Home › Market News › Topstep Trading 101: Triangles (Part 1)
Welcome to the first edition of Topstep Trading 101. The purpose of this series is to educate you on the basic techniques and principles of technical analysis. To a lot of you, this is old news, but for the rest of you, we are here to help you build a solid foundation for reading chart patterns.
In part 1 of this 3 part series we will focus on the symmetrical triangle pattern, with more to come later in the week, so let’s get to it!
In the world of technical analysis, there are 4 major triangle patterns that can signal either trend continuation or trend reversal after a period of consolidation; symmetrical, descending, ascending and expanding. These patterns consist of 2 diverging trend lines, and must contain a minimum of 4 reversal points in order to be considered a triangle.
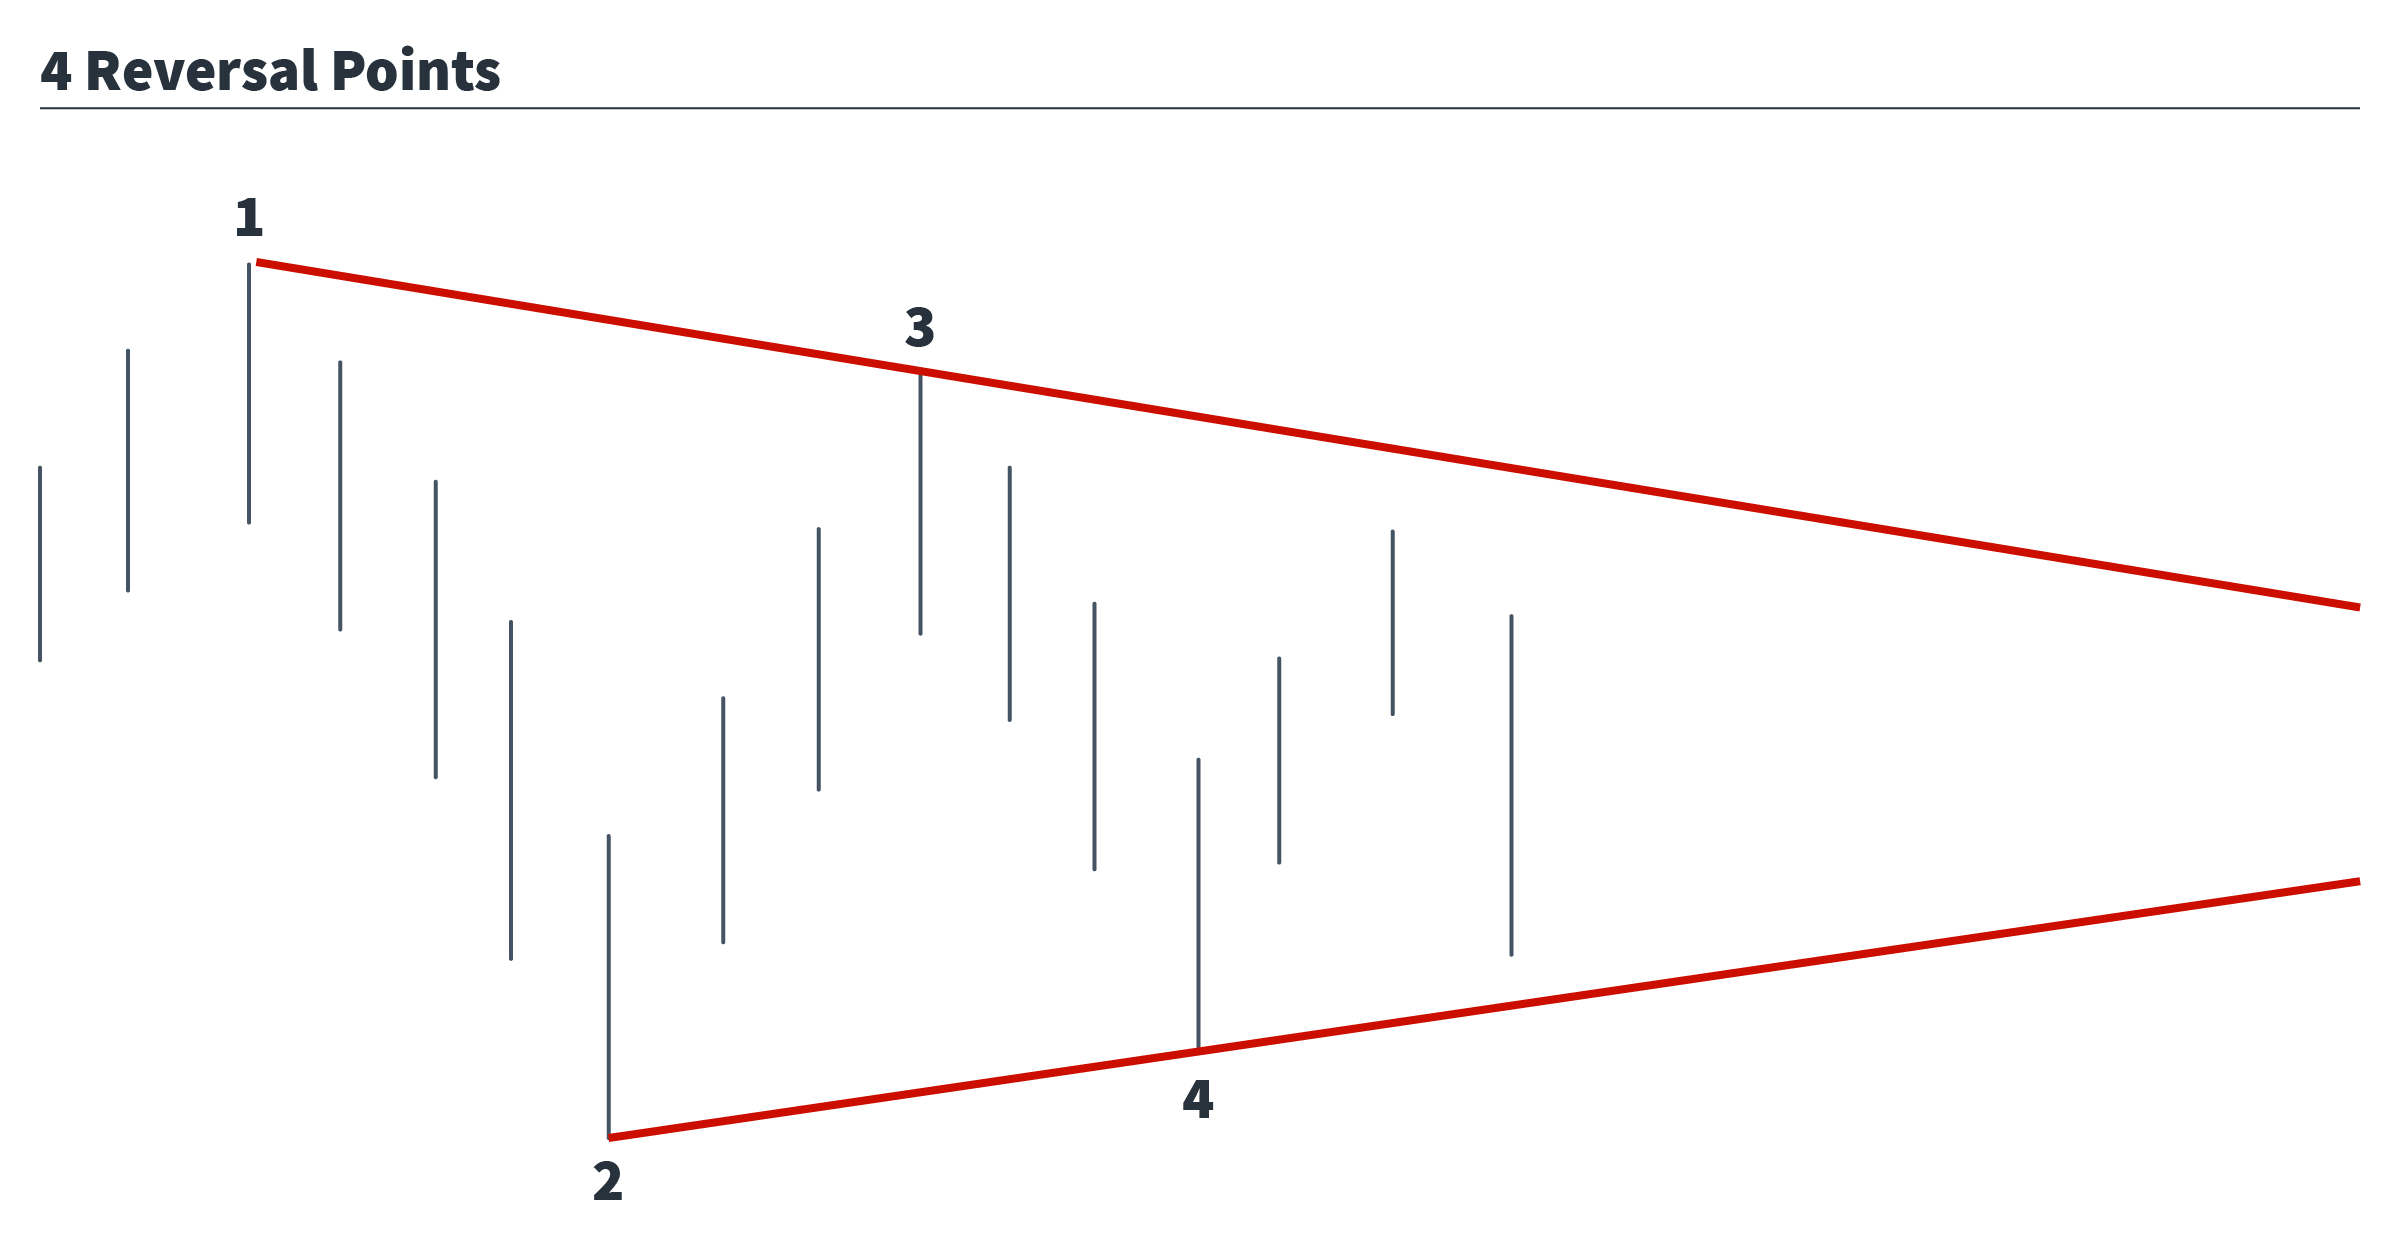
Symmetrical triangles are usually considered a continuation pattern, and consist of a series of lower highs and higher lows, with upper and lower trend lines converging towards an apex. You should expect to see a drop in volume as price moves toward the apex, further signalling the likelihood of a breakout, followed by a sharp increase in volume once the breakout occurs.
Charting purists will insist that the breakout must occur somewhere between the ½ to ¾ mark of the horizontal width of the triangle, but in practice, you will find this is not always the case. In the era of predator algos and HFT programs, false breakout signals are more frequent than ever, so risk should be managed accordingly.
The profit target should be equal to the highest and lowest points at the base of the triangle measured from the breakout price. For example, say the market you are trading is trending higher when the market begins to move sideways. Once 4 reversals points are plotted, take the difference between the first high and first low, this is then the distance price should be expected to move after the breakout.
So, if a triangle produces a high print of $35.00 and a low print of $25.00, that would give a base value of $10.00. If the breakout price is $32.00, then $42.00 becomes the target.
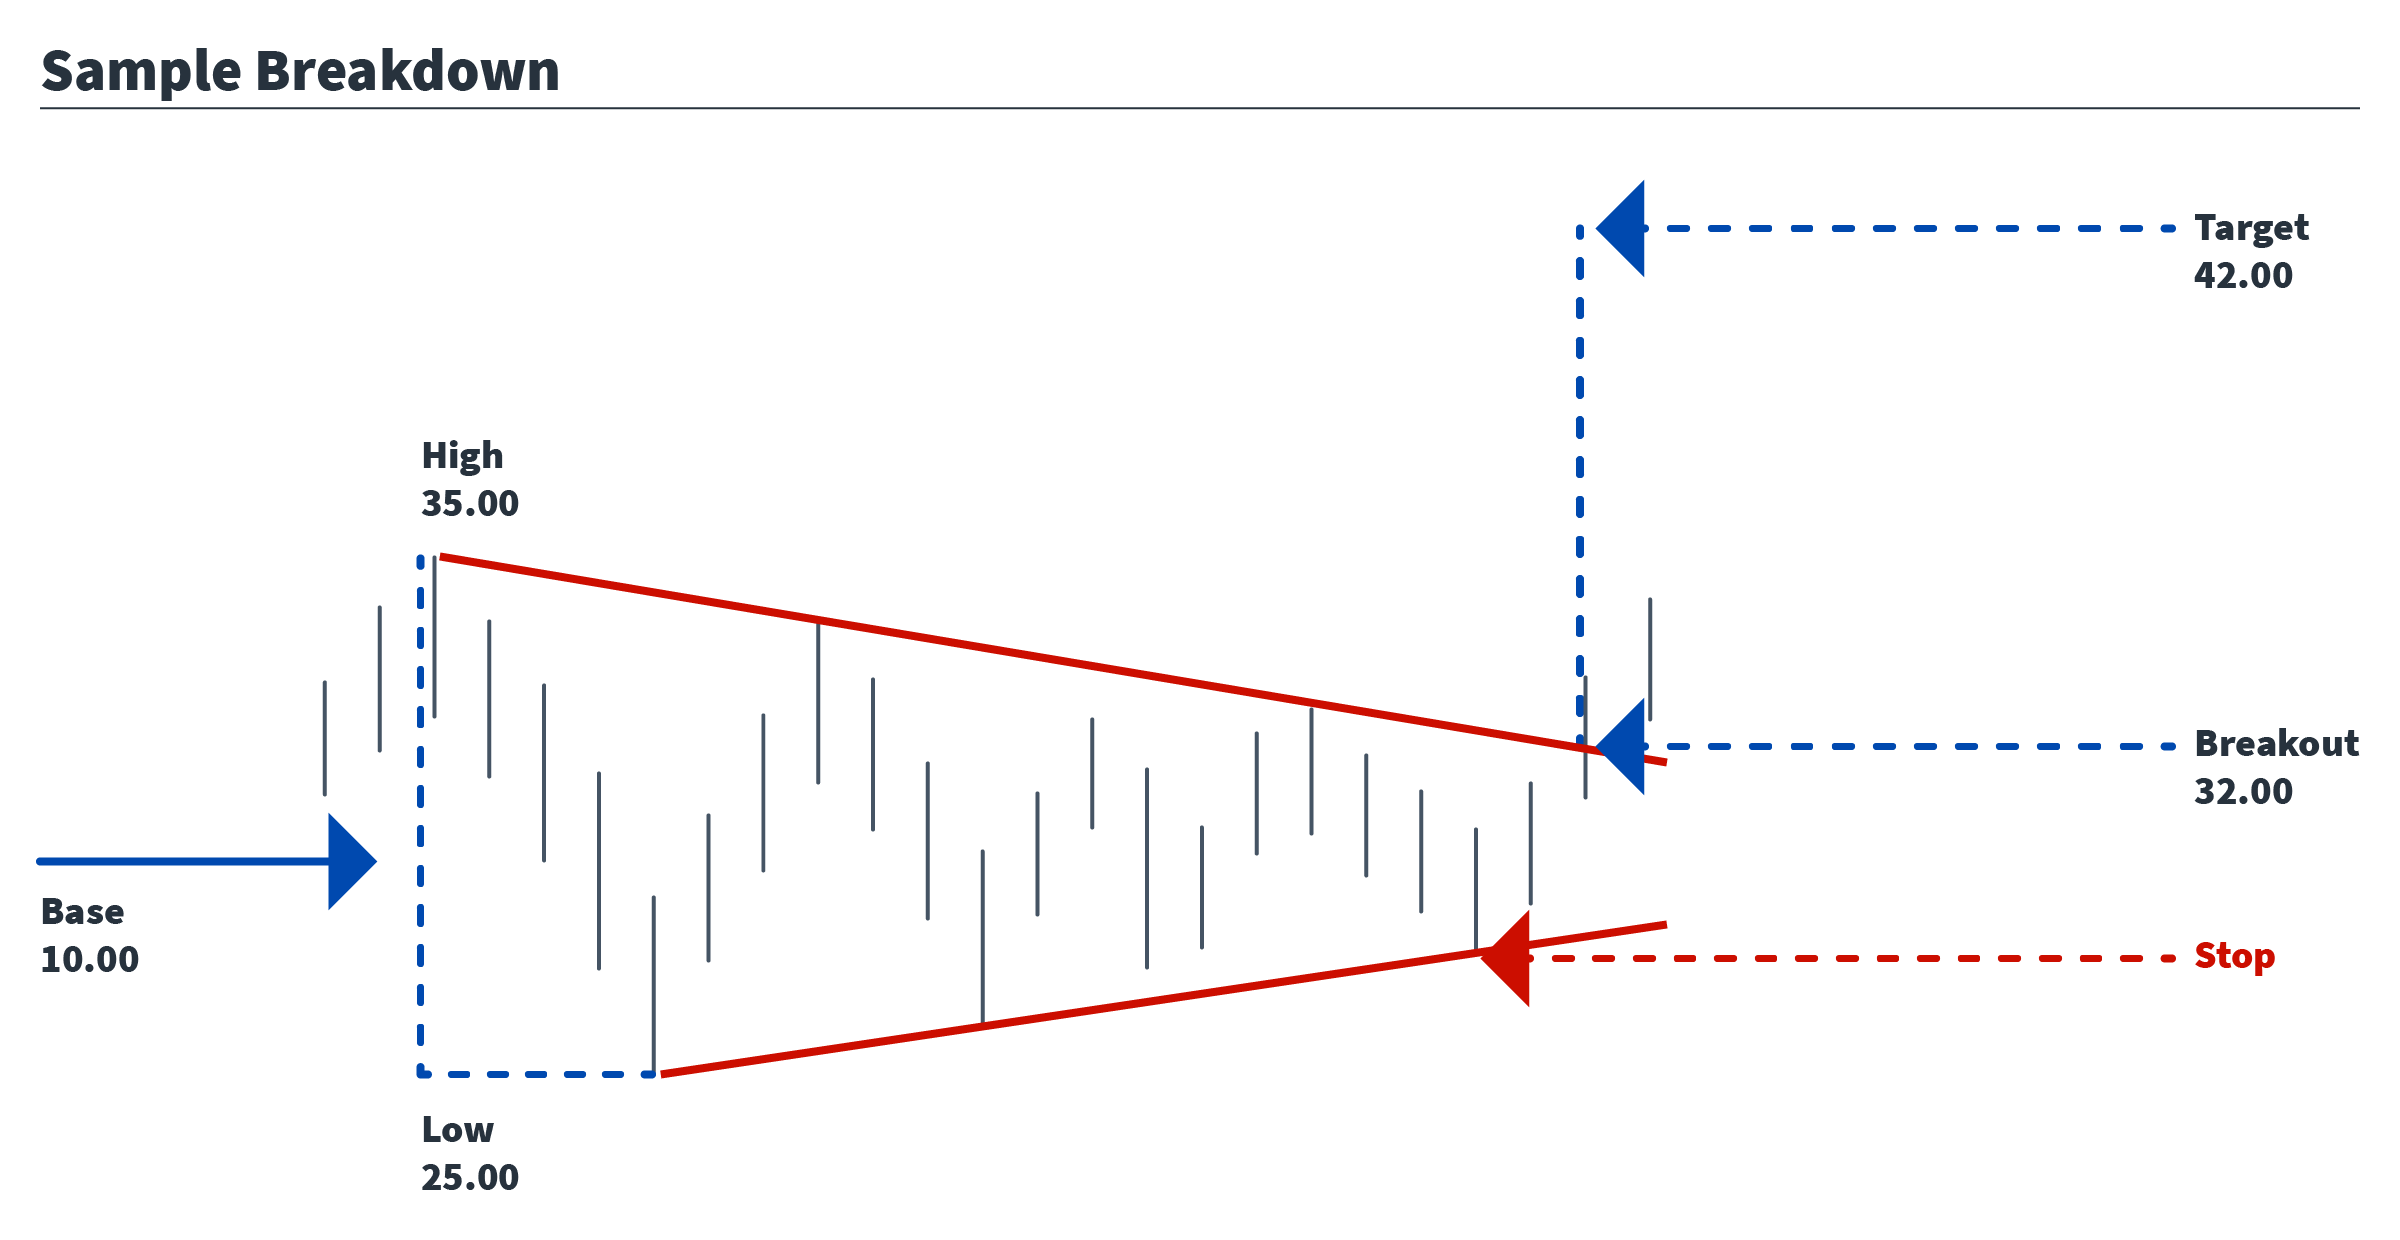
Once a price breakout is confirmed, a stop should be placed below the previous low before the breakout. Again, chart purists will say the stop should be placed just below the breakout level, but the market does sometimes have a tendency to retest the breakout level and hunt for stops (predator algos).
Risk parameters can, and probably should, be adjusted throughout the duration of the trade. For example, once price has passed the 50% mark heading towards the profit target, it’s possible to move your stop up to the break even price. Or, if more than one contract is being traded, you may also begin to scale out of the position at the 50% mark to lock in profits.
Trade Well!