Home › Market News › Topstep Trading 101: The Head & Shoulders Top
The purpose of this series is to educate newer traders on the basic principles and techniques of technical analysis. To a lot of you, this is old news, but for the rest of you, we are here to help you build a solid foundation for identifying patterns on price charts.
The Head and Shoulders Pattern is historically considered to be one of the most reliable major reversal patterns in technical analysis. In today’s lesson, we will focus on the characteristics of the Head & Shoulders (H&S) Top, as well as the minimum price objective after a breakout, and stop loss levels.
Like most reversal patterns, the H&S is most recognizable to an analyst after it has been formed. The real trick lies in being able to identify the attributes of the formation while it’s setting up so you can be ready to initiate a position once the pattern is confirmed.
Aptly named for sharing a few of the same characteristics as the human body, the H&S formation consists of five key reversal points; three peaks, making up the left shoulder, the head and the right shoulder; and two troughs connected by a trendline, also known as the neckline.
First and foremost, in order to be considered a reversal pattern, a H&S top must be preceded by an uptrend. The same as with all other reversal patterns we’ve discussed, volume and time play just as significant a role as price while this pattern is forming.
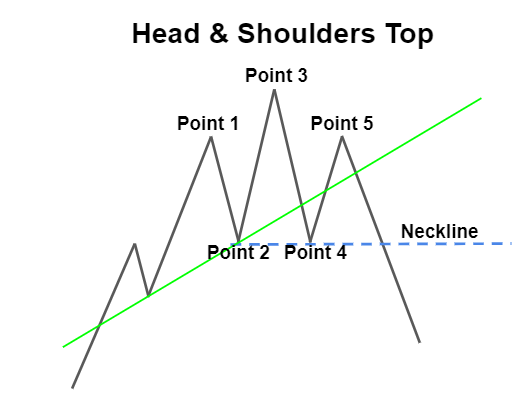
As an uptrend begins to exhaust itself, the left shoulder will begin to form with a rally to Point 1 being made on high volume, followed by a reversal down to Point 2 on low volume. The head is then formed with another reversal to Point 3, typically on lighter volume than the rally to Point 1.
Hint: The new high at Point 3 being made on lighter volume than Point 1 should be your first early warning signal of a possible shift in trend.
Next is another reversal lower from Point 3, breaking through the support line made by Point 1, down to Point 4, on slightly increased volume. Please note, once both troughs have been established, you can now go ahead and draw the neckline connecting points 2 and 4.
Hint: Violation of the support line drawn from Point 1 is your second warning sign of a possible shift in trend.
The right shoulder is formed with a reversal from Point 4 to Point 5 on low volume.
Hint: This part is crucial. The failure of price to rally above Point 3 after reversing from Point 4 results in a higher low, which is a textbook indicator of a downtrend.
Once price reverses lower from Point 5 on increased volume, it should now be clear that a change in trend is occurring, because 1) the initial up trendline has been broken, and 2) the market has effectively printed a lower high and is continuing to trade lower.
Confirmation of the pattern is made when a price bar closes below the neckline on high volume. Because of the number of objectives that need to be met in order to confirm this pattern, it is advised to not initiate a short position until confirmation has been made.
The measured move for a H&S top is the distance between Point 3 and the neckline, measured downward from the breakout price. For example, let’s say the high price at Point 3 is $210, and the price at the neckline measured straight down from the high is $170, your measuring objective now becomes $40. So, if the breakout price is also $170, your first price target would be a measured move of $40 lower, or $130.
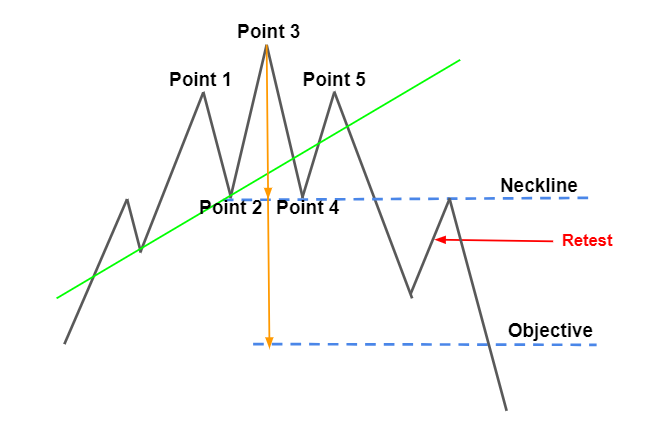
If the breakout does not occur on high volume, then it’s common to see a retest of the neckline. The retest should be made on lower volume, or else it’s possible the pattern has produced a false signal. On the other hand, a breakout occurring on extreme volume usually indicates price will continue lower without a retest of the neckline.
There are 3 common areas traders will use to exit their positions if the pattern fails. The first, and most conservative, is a violation of the newly formed down trendline. It is believed by some that the breach of a major trendline is a precursor to a trend reversal, and any short positions should be covered.
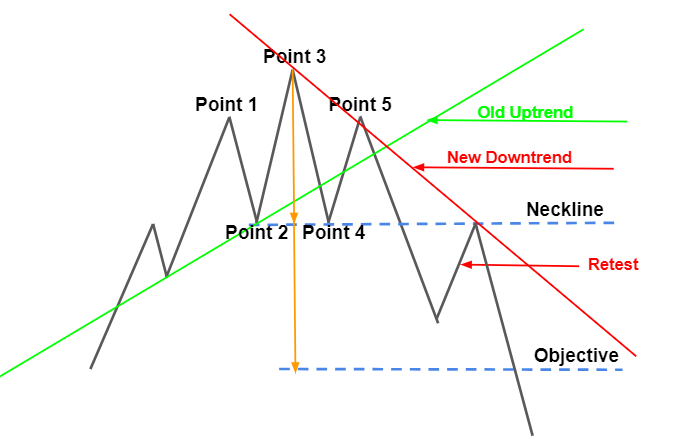
The second level, and most common, is the neckline, because this would indicate the failure of new resistance levels to hold. Lastly, and the most extreme stop level, is a breach of the initial uptrend line. If price gets back to this level, it usually means another trend reversal has occurred, and new highs are being made.