Home › Market News › Topstep Trading 101: Double Bottoms
The purpose of this series is to educate newer traders on the basic principles and techniques of technical analysis. To a lot of you, this is old news, but for the rest of you, we are here to help you build a solid foundation for reading price charts.
In this lesson we’ll be taking a look at Double Bottoms. If you have been following our Trading 101 series, then a lot of this may sound redundant, mostly because the double bottom is almost an identical mirror image of the double top setup. The definitions are the same, and the nuances you’ll encounter identifying price points are similar.
The double bottom is first and foremost a reversal pattern. This means that whatever direction the trend was going when the double bottom formed can be expected to reverse once the pattern is confirmed.
Price, volume and time are all key components when identifying a double bottom.
Double bottoms are not quite as common as double tops, however, they do share many of the same characteristics. This pattern usually develops around major market bottoms, but can really be traded on almost any timeframe. They are easily identified by two lows, at or near the same price, separated by a peak in the middle.
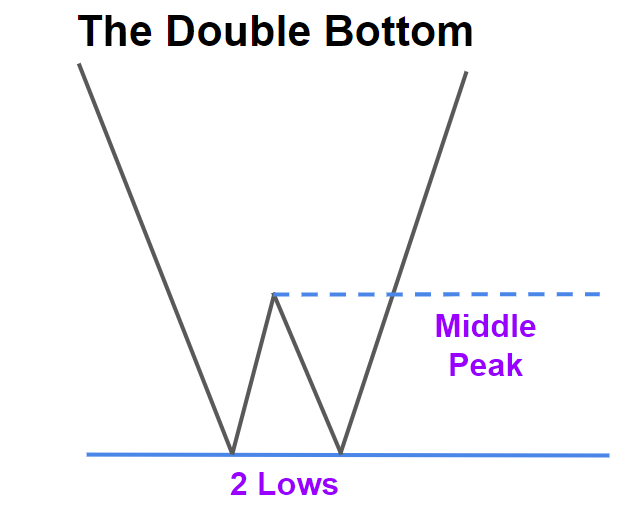
Prices at the lows do not have to be an exact match. The second low will typically be higher than the first low, signaling an exhaustion of selling pressure, of course there are exceptions. If the second low does dip below the first low, then you can assume it’s either a stop hunt or a “bear trap” setting up.
.png)
The first low should be made on significantly higher volume than the second low, and a decrease in volume should be noticeable when the middle peak is formed. Time also needs to be considered. The longer it takes for the two low to form, and the greater the distance from the peak to the low, the higher the probability is for a reversal.
A price bar closing above the middle peak on heavy volume will confirm the reversal.
The measuring objective for a double bottom is the distance between the highest point of the peak and the trendline connecting the two lows. This distance should then be measured upward from the breakout point to determine the price objective.
Confirmation of the double bottom must be made with a price bar closing above the highest point of the peak before a position should be initiated.
The resistance area where the peak was formed turns into a support level after the breakout has occurred, and it’s common to see a retest of this level before the price objective is met. More aggressive traders will often use a retest as an opportunity to add on to their position if the volume and time patterns are also signaling a strong probability of trend reversal.
.png)
Just like with the double top, the jury is still out when it comes to stop placement. There’s really no right or wrong answer, so risk management parameters should be adhered to.
Some traders will use the 50% retracement of the measured move, bollinger bands, or even short-term moving averages to determine stop levels. These are all acceptable, so your best bet is to already have a plan in place before initiating a position.
It’s difficult to identify a double bottom in mid-formation because of the possibility that price is stuck in a consolidation period and the trend may continue lower. The middle peak is an important resistance area while the pattern is forming, and if it holds, can sometimes lead to the formation of a continuation pattern.
This is why it’s so important to wait for price to trade through and close above the peak resistance area for confirmation. It’s easier to avoid being trapped in a false breakout scenario if you play this setup by the book.
Trade Well!