Home › Market News › Topstep Trading 101: Pennant Formations
The purpose of this series is to educate newer traders on the basic principles and techniques of technical analysis. To a lot of you, this is old news, but for the rest of you, we are here to help you build a solid foundation for reading chart patterns.
If you read the article on Flag Patterns, then this may seem a bit redundant. Similar to the Flag Pattern, the Pennant Formation is one of the most common chart patterns found in technical analysis, and can be either a bullish or bearish signal of trend continuation. This shorter time frame setup usually forms mid-trend and represents a temporary pause, or consolidation, that moves counter to the prevailing trend.
Pennants will appear frequently on your chart, so there are some key characteristics to look for when attempting to identify this pattern. Just like with the Flag Pattern, you will need to be cognizant of the direction of the prevailing trend, volume patterns, size and duration of the consolidation period.
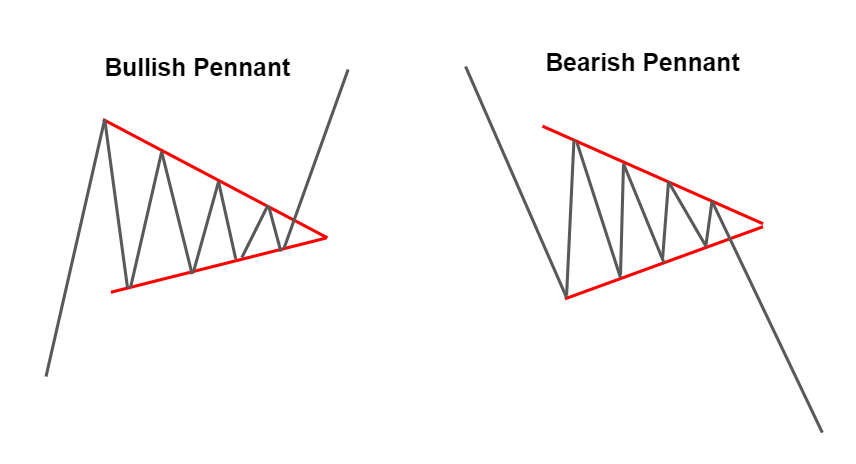
A pennant is drawn using 2 converging lines meeting at an apex as price consolidates. This formation has the appearance of a very small symmetrical triangle. There are no minimum or maximum number of reversal points required to confirm this pattern, but historically the duration should not exceed 20 price bars.
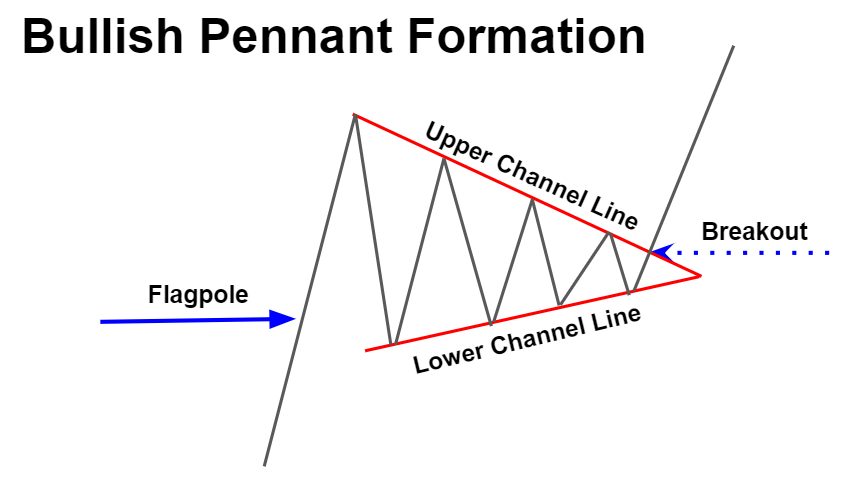
The preceding price move leading up to the pennant formation is commonly referred to as the pole, or flagpole. The retracement from the starting point of the flag should not exceed more than 50% of the flagpole. Anything more than a 50% retracement would then be considered a change in trend.
Pennants are dependent on both volume and price for confirmation. After a steep rise or fall in price, volume should start to decline as the market begins to consolidate and move counter to the prevailing trend. Breakouts should occur on a significant spike in both volume and volatility.
The setups for both bullish and bearish pennant formations are very similar to the flag pattern, with just a few slight changes in price action differentiating the two.
When a bullish pennant is identified, aggressive traders will enter long positions at, or near, the bottom channel line. Because this pattern consists of a series of lower highs and higher lows, stops can be placed at new lows, then positions can be reopened if a false breakout is confirmed. More conservative traders, on the other hand, will wait for a price bar to close above the upper trend line on increased volume for confirmation of a breakout before initiating a position.
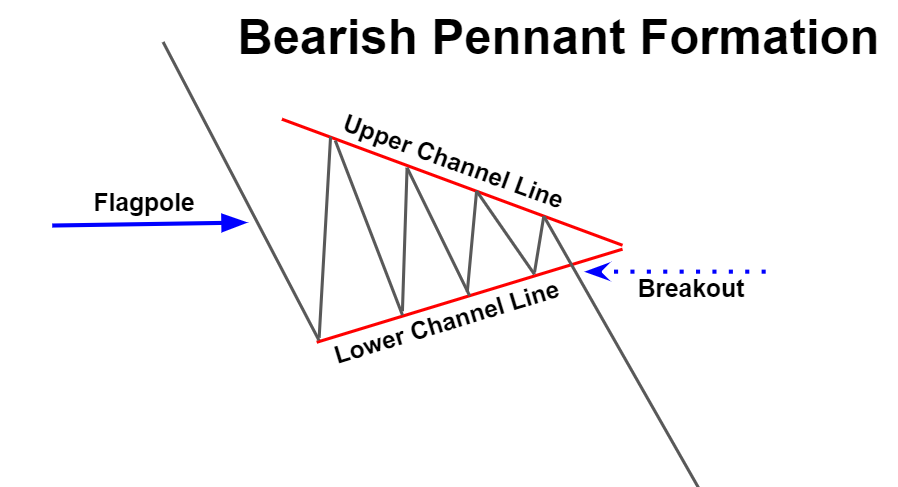
These techniques are inverted when a bearish pennant is identified. Aggressive traders will use the upper channel line for entry, while conservative traders will wait for a price bar to close below the lower trend line on increased volume to confirm the breakout.
It’s easy for a false breakout of a pennant to quickly turn into a flag pattern, so be diligent on your risk parameters and re-entry levels. Pennants eventually become significant psychological support and resistance areas over time, so a stop above or below the highest or lowest point of the flag can be considered a safe zone.
Charting purists will say that the target price after a breakout should be equal in distance to the size of the move preceding the pennant, which is the same strategy used with the flag pattern.
In conclusion, pennants are continuation patterns. To properly identify this setup, volume patterns should coincide with price movements, and risk parameters should already be in pace before initiating a position.
Trade Well!