Home › Market News › How Linda Raschke Approaches the Market Open
Linda Raschke is a futures trader who has been through it all. Bull markets, Bear markets, the takeover heydays of the 1980s, the low volatility grinding post-GFC. She started as a floor trader, traded ‘upstairs’ from the floor, managed money for decades, and now trades from home in her ‘semi-retirement.’ If you ask Adam Grimes, whom we profiled last week, the vast majority of floor traders who tried to adapt to electronic trading failed desperately.
Linda’s trading career got started almost by mistake. She landed her first job after college at a broker-dealer that happened to be across the street from the late Pacific Coast Stock Exchange in San Francisco. Due solely to her curiosity, she began hanging out there before work and scoping out what the hell was going on. The floor traders took a liking to her, and eventually, she got staked for $25,000 and became a floor trader. Not long after, she went bust buying short straddles on Cities Services (Citgo) before a takeover bid.
Fast forward a few years, and Linda has finally paid off the debt from her Cities trade and decided to buy a horse. As luck would have it, she suffered a freak horse-racing accident which forced her to trade upstairs in her clearing firm’s office. Without seeing the real-life indicators of the trading pit, Linda was forced to adopt a more data-focused approach, which ended up being a blessing in disguise, as it set the framework for her trading for the coming decades.
Linda Raschke is one of the few examples of a floor trader who not only successfully made the switch, but became one of the most notable traders of the last few decades.
In this article, we’ll take a look at how Linda approaches the market open, with emphasis on index futures.
Much of Linda’s trading is based on the three-day cycle devised by George Douglas Taylor in his book The Taylor Trading Technique. Taylor thought that stocks and commodities were manipulated by “smart money” in order to create buying opportunities for themselves. The idea here is that without manipulation, the security might be in a more clear uptrend, but “smart money” manipulates it lower every few days so they can accumulate their shares at favorable prices.
This idea of smart money creating buying opportunities for themselves is echoed by other legendary traders that Linda has learned from; like Richard Wyckoff and his ideas of accumulation and distribution.
Regardless of whether you buy into these theories or not, this style of trading clearly works for Linda, making it worthy of our time.
Taylor set out a basic heuristic for categorizing each day of market action.
Linda is much more selective with her use of this system, and generally tries to place trades that are in the direction of the trend. If the weekly chart is showing a long-term downtrend, she is much less likely to buy on a buy day then if the market is in an uptrend.
While she has many different setups to trade this framework, I think her way of structuring price action is more useful to glean wisdom from.
Each day on the open, Linda has already established both a directional bias (bullish or bearish) and a situational bias (are ranges expanding or contracting? Trending or range-bound?) for each of the markets she actively trades. These biases are used in conjunction with her swing analysis to find trade opportunities.
Whether she’s looking for a Taylor-style swing setup or a day trade, establishing a directional bias and ‘day type’ is one of the cornerstones of Linda’s trading.
Because Linda trades several futures markets, this means different things for different markets. But, because most of our funded traders prefer US stock index futures, let’s shift our attention to Linda’s index analysis.
Linda uses some neat market internal indicators, like the NYSE TICK index and the cumulative NYSE volume, to establish her top-down view of the indexes.
The first internal indicator she looks at is volume breadth. In her CQG platform, she will create this index by combining two tickers: DJIUP-DJIDN. This subtracts the total amount of volume on declining issues from the volume occurring in advancing issues. She then applies a 5 and 10-day moving average to this index to smooth out the noise.
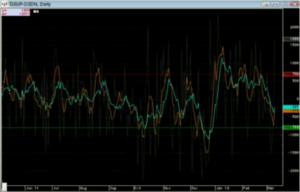
Treating this like any technical oscillator, Linda will use it to spot overextensions in quiet markets, and severe momentum in trending markets. One of the key things she looks for is a “breadth thrust” (see January in the above chart), which is when several of her breadth indicators are registering extremes, usually indicating that substantial momentum has entered the market–which tells us that it’s probably not a good time to fade the market until you see some divergences.
Another indicator, which I’ve already talked about at length here at Topstep, is the NYSE $TICK index (I wrote about it here and here), which is a net reading of how many stocks are currently upticking or downticking. Linda also smooths out this data, which looks more like an ECG than a price chart, by applying some price bands on it. They’re a 10-day moving average of the $TICK’s daily highs and lows plotted around a 5-day moving average of the closing print of the $TICK.
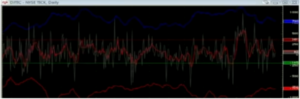
Linda’s ‘secret’ to using the $TICK is to use it as a technical oscillator:
“When those bands squish together so that there’s a narrow range, that starts to indicate a contraction in volatility, and therefore a bit of complacency. You’ll usually see those bands start to narrow near market tops. Then, of course, at market bottoms, there’s lots of fear and extreme readings in the $TICK, both to the upside and the downside. When those bands get really far apart, that, to me, represents an intermediate-term buying opportunity.” – Linda Raschke talking about the NYSE $TICK index
Linda’s use of the cumulative NYSE volume is pretty rare. It’s something that I never really hear other traders speak about. Many dismiss it due to the amount of exchange fragmentation present in the US stock market, but Linda has continued to use it throughout the decades and maintains that it still has utility.
Essentially, if the first 30 minutes of volume in the NYSE far exceeds that of the previous five or so days, that could strongly indicate a trend day. Considering that the NYSE is still responsible for roughly 20% of volume, I think it’s still a great gauge.
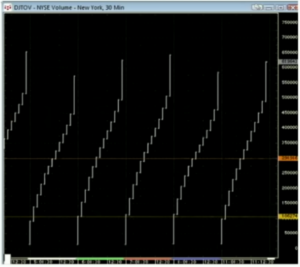
Over the years, she has seen that the first 30 minutes of volume has also been an indicator of the level of activity in other futures markets, like bonds and currencies. In her words, it’s a “tone setter” for the rest of the market. As a result, she is careful taking any breakout trades during low volume periods and gets aggressive on high volume days.
Much of Linda’s top-down analysis is based on volume. She uses a daily chart of volume breadth to see where the money is flowing in the intermediate-term. When volume keeps flowing into declining issues, she knows there’s a lot of money on the sidelines waiting to jump back in at the next reversal.
You can view her volume breadth analysis as getting a feel on the positioning of the market participants, and the NYSE cumulative volume as her indicator for when those participants are changing their positions.
This, in conjunction with the $TICK index and swing analysis, is her framework for organizing price action.
If you would like to hear more straight from Linda herself, check out this Limit Up! Podcast interview we did with her back in 2018.


