Looking at market internals is like looking under the hood of a car. From outside the vehicle, you can see a lot. If the car is making odd noises, if smoke is emitting from the exhaust pipe, and so on. But to know what is going on with the engine, you have to pop the hood. The same is true of the stock market.
The price action of /ES tells you how the overall market is doing, but you can’t answer questions like:
- Are more stocks advancing or declining today?
- Is more volume flowing into advancing or declining stocks?
- Is this rally supported by the majority of stocks or a few mega-caps holding it up?
Most market internal indicators are indexes created by the major exchanges to give us information about how the broad market performs. This might be a net-reading of how many stocks are up ticking or down ticking on a second-to-second basis ($TICK) or a measure of the premium present in various SPX options (^VIX).
The objective of these indexes is to give traders a better understanding of how the market is moving on a micro-level (looking at how ALL individual stocks are doing) compared to looking at it on a macro level (using /ES as a gauge for market performance).
Why use market internals?
Confirmation
Market internals function as great confirmation indicators for already robust trading systems. They can help improve the strength of trade signals with a positive expected value.
Perhaps you trade a VWAP mean reversion system which identifies overextensions from the VWAP within ranging markets. A situation may arise where the price of /ES is two standard deviations above the VWAP, which would usually produce a sell-signal, but all of your market internals have turned bullish, which might prompt you not to take this sell-signal. This is a rudimentary example meant to get you thinking about how you can use market internals to improve your system’s profitability.
However, one thing to note is that optimizing your trading systems based on market internals will generally produce fewer trade signals, giving you fewer opportunities to profit. You have to strike the right balance between trade frequency and your per-trade profit expectancy. You can optimize a system so much that it only trades once per year, which is, of course, foolish.
Additional Context
Price is, of course, what pays at the end of the day, but when trading index futures, it certainly helps to know what (or how many) issues are driving the move. If Apple and Amazon have great days, but the rest of the market is suffering, you won’t get the full picture, as just two issues are obfuscating what the rest are doing. If you watch market breadth indicators like the Advance-Decline Index or the $TICK, it becomes clear which moves are supported by the entire market and which ones are supported by few issues, making your trade more reliant on the performance of a few individual stocks.
Divergence
Most futures traders who use market internals as a regular part of their trading use them to spot divergences between /ES and market internals.
A divergence between /ES and market internals refers to situations where the price action of /ES and market internals disagree. Imagine a situation where /ES breaks out from a critical resistance level. You may expect to see a surge up-volume on the $UVOL-$DVOL indicator or a rise in advancing issues on the Advance-Decline Index. If you don’t, that is called divergence and is usually seen as a negative sign by traders. Seeing this divergence, they might opt to fade that breakout, expecting it to fail due to the broad market’s lack of support.
Examples of Divergences:
- The $TICK index shows an extreme reading of +/- 1000, without significant volume or momentum present in the market. This would present an excellent opportunity to expect a counter-trend move.
- /ES is making new highs, unaccompanied by $ADD
- Lots of volume is coming during a big move in /ES, but $UVOL-$DVOL remains steady
Filter For Developing a Bias
Developing some bias for the trading day is essential. If done correctly, it will not only increase your win-rate and expectancy but will usually keep you out of what would be your worst trades.
There are several biases or “daily filters” that market internals can help you develop. Here are a few examples:
- Directional bias: only taking long or short trades for the day
- Trend bias: only looking for trend trades on trend days and range trades on range-bound days.
- Volatility bias: Decreasing your size or trade frequency based on the level of volatility in the market
- Red light, green light: Having parameters that give you the green light to take trades or the red light not to take any trades.
The two most important market internals
The S&P 500 Volatility Index (VIX)
Of the oft-used market internals, VIX is by far the most well known due to its prominence in the financial media as the ‘fear gauge.’ The VIX is an index published by the CBOE that measures the level of premium (or implied volatility, same principle) present in a range of SPX option contracts. This calculation is meant to give us insight into the level of volatility or fear present in the broad market.
The belief behind the index is that when premiums on specific SPX options get high, investors are bidding them up to use them to hedge their stock portfolios due to near-term uncertainty. The index is meant to project the 30-day implied volatility of the S&P 500.
As a generality, the VIX moves inversely with the price of the S&P 500, meaning the VIX goes down when the S&P 500 goes up, and vice versa.
So, how do we use the VIX as an indicator? I’ll lay out two ideas below, one for creating mean-reversion signals and the other for creating a red light, a green light filter that will tell you when to start and stop trading, something more of us should pay mind to. Logging your trades with a journal like TraderVue can reveal that we can reduce our trading losses significantly solely by avoiding trades in certain market conditions.
Mean reversion: is volatility mean reverting?
One of the most popular trades over the last decades has been short volatility. It seems like it happens every month that a major investment bank is publishing research that calls out short volatility as the most crowded trade in the market. The critics were eventually proven correct as the market experienced “volmageddon” in early 2018, but it didn’t stop traders from piling back into the trade shortly after.
There are many ways that traders tend to make this trade, but one direct way is to take a synthetic short position in the VIX after a massive spike, expecting it to calm in the following days or hours. Intuitively, this type of strategy makes sense because the VIX looks more like an ECG than a price chart. Here’s a chart of a 10-week moving average of the VIX:
The idea that volatility is mean-reverting in nature is not agreed upon by academics or practitioners. This is an issue that academics are pretty split on. There’s tons of research done on volatility in options and equity markets, with that comes lots of diverse views. One prominent way of viewing volatility is through what is called GARCH modeling. It’s super academic stuff, but research using this methodology finds that volatility is clustering, meaning that periods of high volatility tend to cluster together, which would be at odds with the view that volatility is mean-reverting. For a plain-English overview of this approach, ThoughtCo published a pretty good article on volatility clustering.
On the other side of the coin, many take issue with the GARCH approach to modeling volatility and instead take a more straightforward view: volatility tends to trend in the short-term (intraday) and mean revert over longer time horizons.
Depending on your trading style, philosophy towards markets, and trading experience, you’ll probably fall into one of the above camps, which one doesn’t really matter because there are good traders on each side of the argument.
For those that hold that volatility is mean reverting, the VIX has created many profitable trading systems or at least augmented pre-existing systems/strategies. One example is Larry Connors’ VIX 5% Rule, laid out in his book Short Term Trading Strategies That Work.
His rule states that:
“The higher it is [VIX] above the 10-day moving average, the higher the likelihood the market is oversold, and a rally is near. On the other end of the spectrum, the lower it is below the 10-day moving average, the more the market is overbought and likely to move sideways-to-down in the near future.”
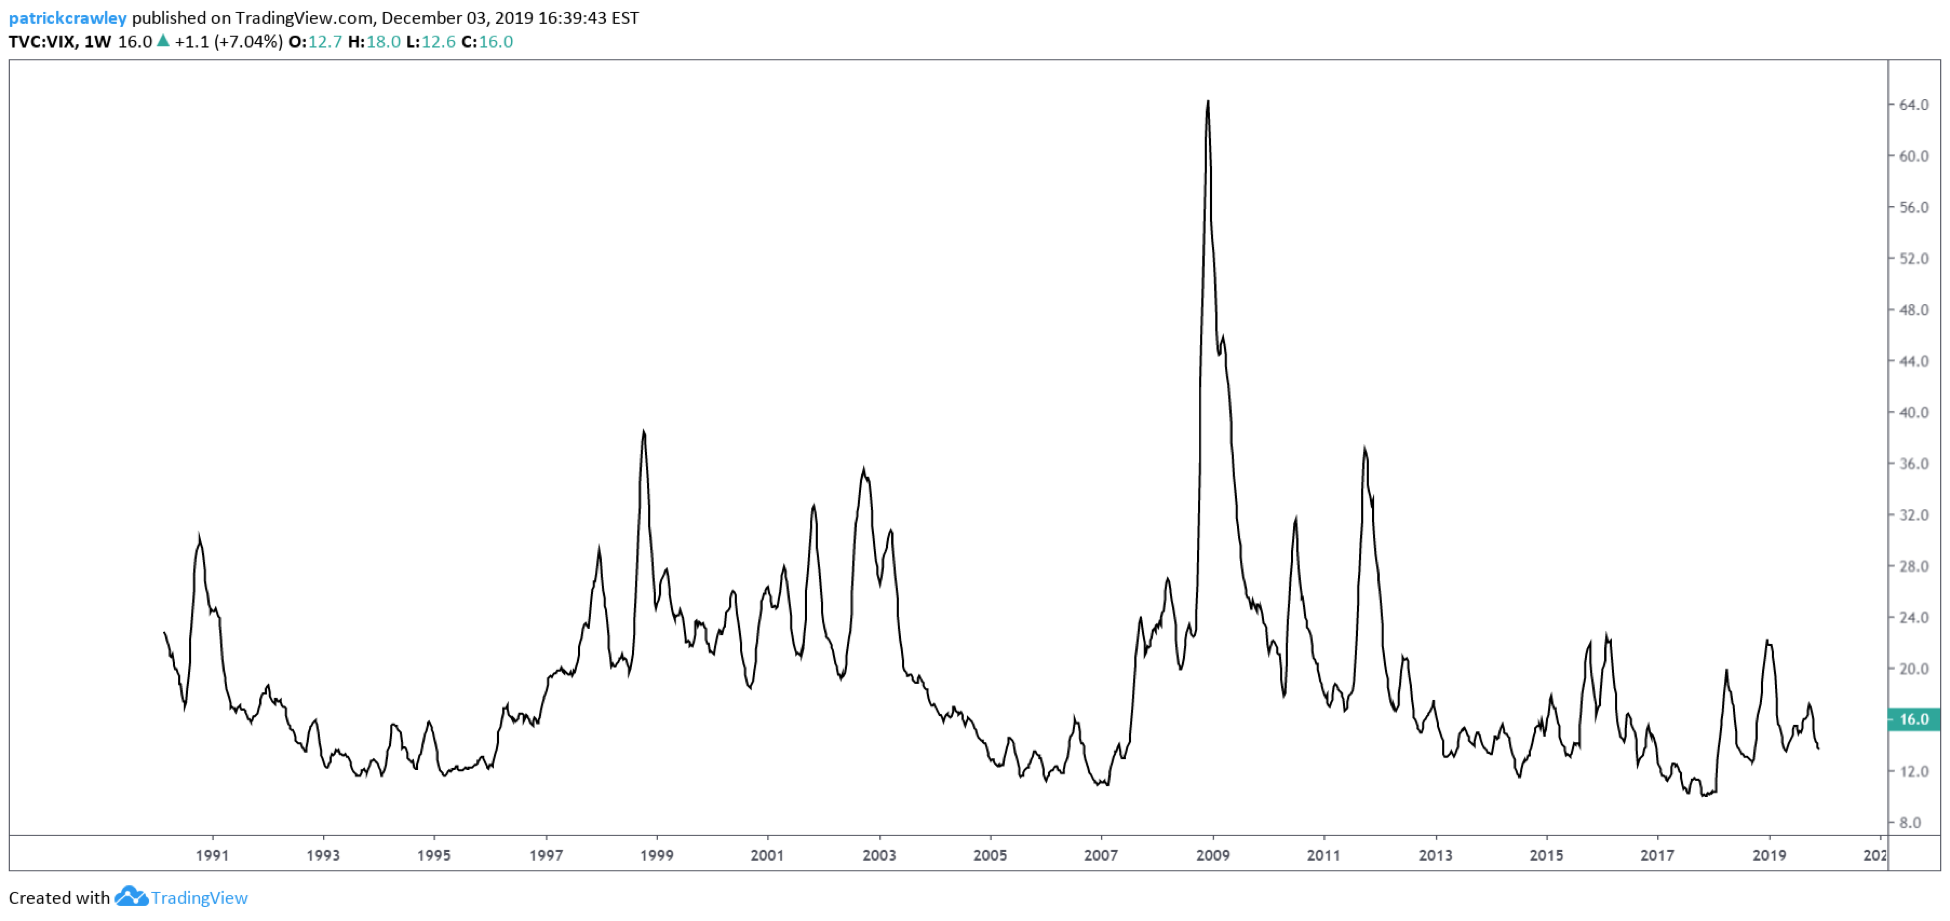
Here are two charts to provide some visual perspective to Connors’ view of the VIX mean-reverting. The first is simply a 10-week moving average of the VIX since 1990, and the second is a daily chart of the VIX with Keltner Channels plotted around a 10-day simple moving average.
10-week moving average of the VIX index
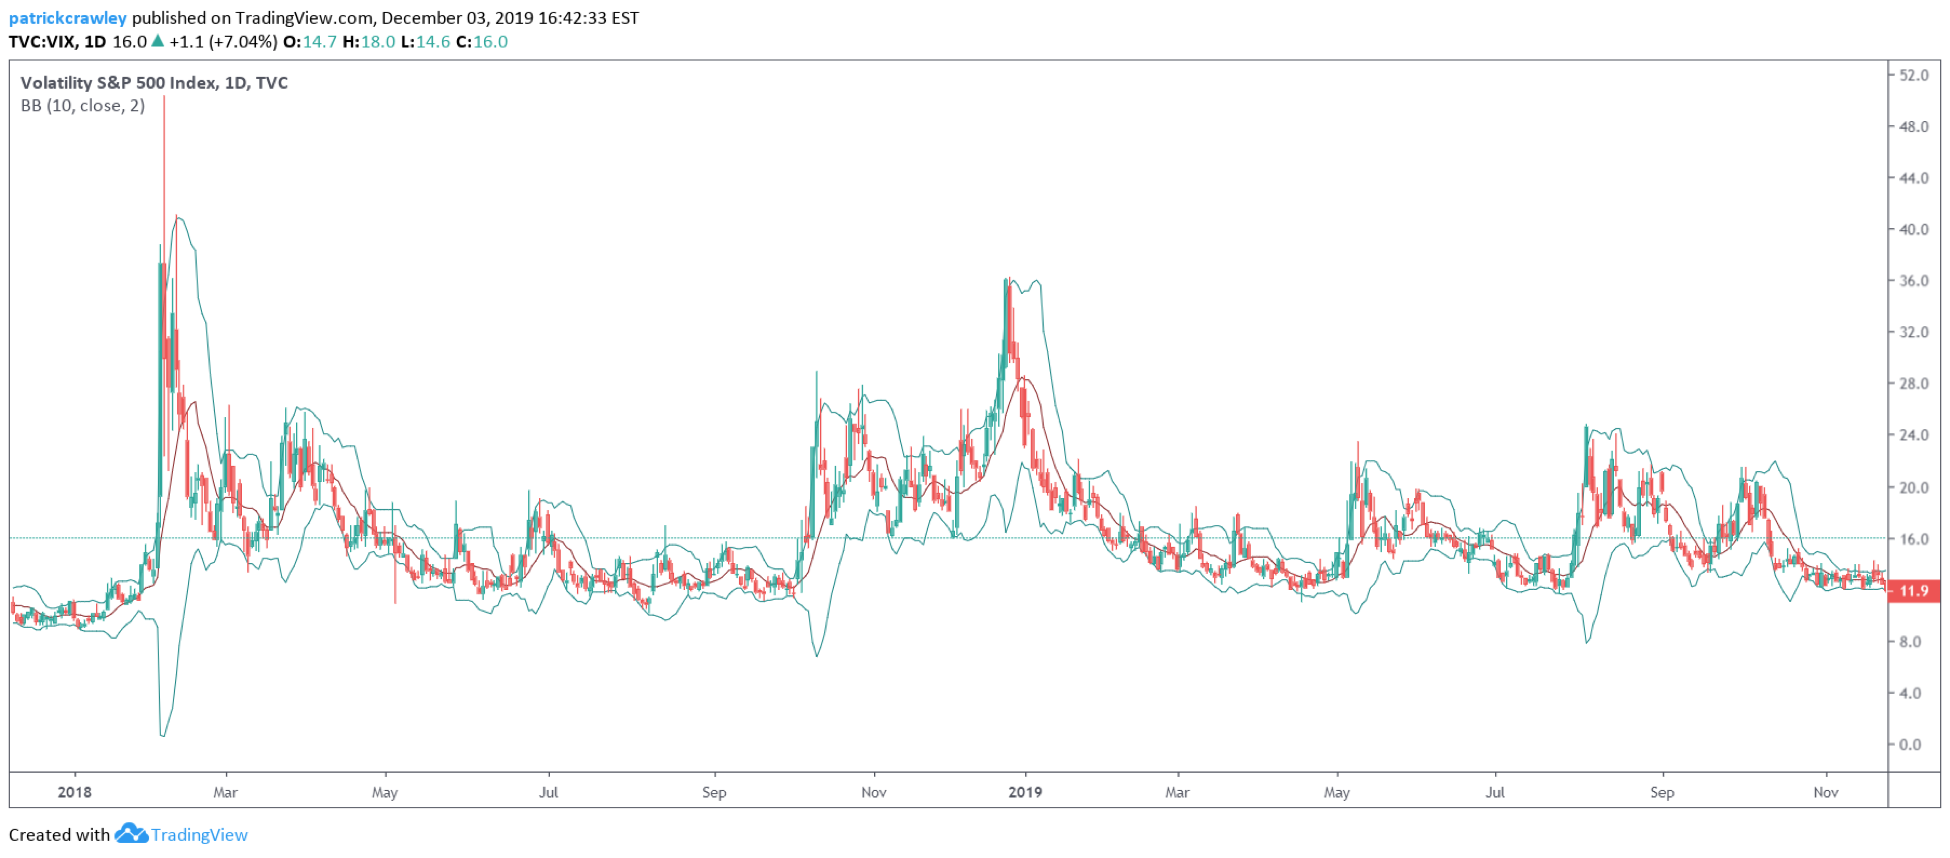
The daily chart of the VIX with two standard deviations Bollinger Bands plotted around a 10-day SMA.
Based on Connors’ view of the VIX as an overbought/oversold indicator, he and Cesar Alvarez developed the VIX Stretch strategy, a simple set of rules used for market timing the S&P 500 (in his case, he used SPY). Here are the rules, straight from the book:
- The SPY is above its 200-day moving average (you can use the SPX also).
- The VIX is stretched 5% or more above its 10-day MA for three or more days. If this occurs, we’ll buy the market on the close.
- Exit when the SPY closes above a 2-period RSI reading of 65 or more.
The results were pretty good. Over 33 trades, the strategy had an 84.85% win-rate with an average hold time under five days. Of course, 33 trades is a small sample size with all types of biases (like market conditions, trade execution, and so on.), but an idea like this can serve as a starting point for your backtesting and strategy development.
VIX as a red light, green light filter
The idea of having conditions that determine when it’s okay and not okay to trade is simple but makes a world of difference. I recommend you read Fernando Oliveria’s (author of Traders of the New Era) blog post on this subject. He doesn’t use the VIX as a filter, but the time of day. Using TraderVue (trading journal software), Fernando determined that net-net, he’s a losing trader outside of the first and last hours of the Regular Trading Hours (RTH). This simple realization presumably improved his expectancy, as he had to eliminate all trades outside of those time periods, and he would reduce his losses.
We know that day traders live and die by volatility. In a grinding, low-volatility market, it is challenging for day traders to make money, and many of them struggle to break-even, as their counterparty is usually an algo who has better short-term expectations than them. Using the VIX as a “red light, green light” filter can reduce the number of noisy signals you receive due to low-volatility conditions.
There’s a variety of ways you can define highly volatile market conditions. You can measure the rate of change of the VIX, daily percent change, deviation from a moving average of some sort, and so on. These methods are likely to produce similar results but do your own testing to see what works for you.
A few ideas for you to test:
- Red light: VIX is inside one standard deviation Bollinger Bands plotted around a 10-day SMA. Green light occurs when VIX is outside of the bands.
- Using Larry Connors’ VIX 5% Rule. When VIX is 5% or more above its 10-day SMA, it’s a green light, red light when it’s not.
- The VIX’s 14-day rate of change (technical indicator available in most charting packages) is above the zero line.
The NYSE $TICK Index
We spoke about the $TICK last week in 3 Indicators /ES Traders Need to Watch, so it should serve as no surprise that it’s coming up again. The index calculates the number of upticks versus downticks on all NYSE stocks and comes out with a net number of how many stocks are ticking up or down. For example, a reading of +600 indicates that 600 more stocks are up ticking at that moment than downtick. The index is updated by the NYSE every few seconds.
The $TICK is generally only useful on the intraday time frame. The net number of stocks up ticking versus down ticking on a second-to-second basis loses utility quickly. Once you go out to a longer time frame, you’re much better off looking at the Advance/Decline Index.
Here’s a chart of the $TICK. I have the zero line and +/-1,000 lines plotted on the chart, along with a 10-period simple moving average.
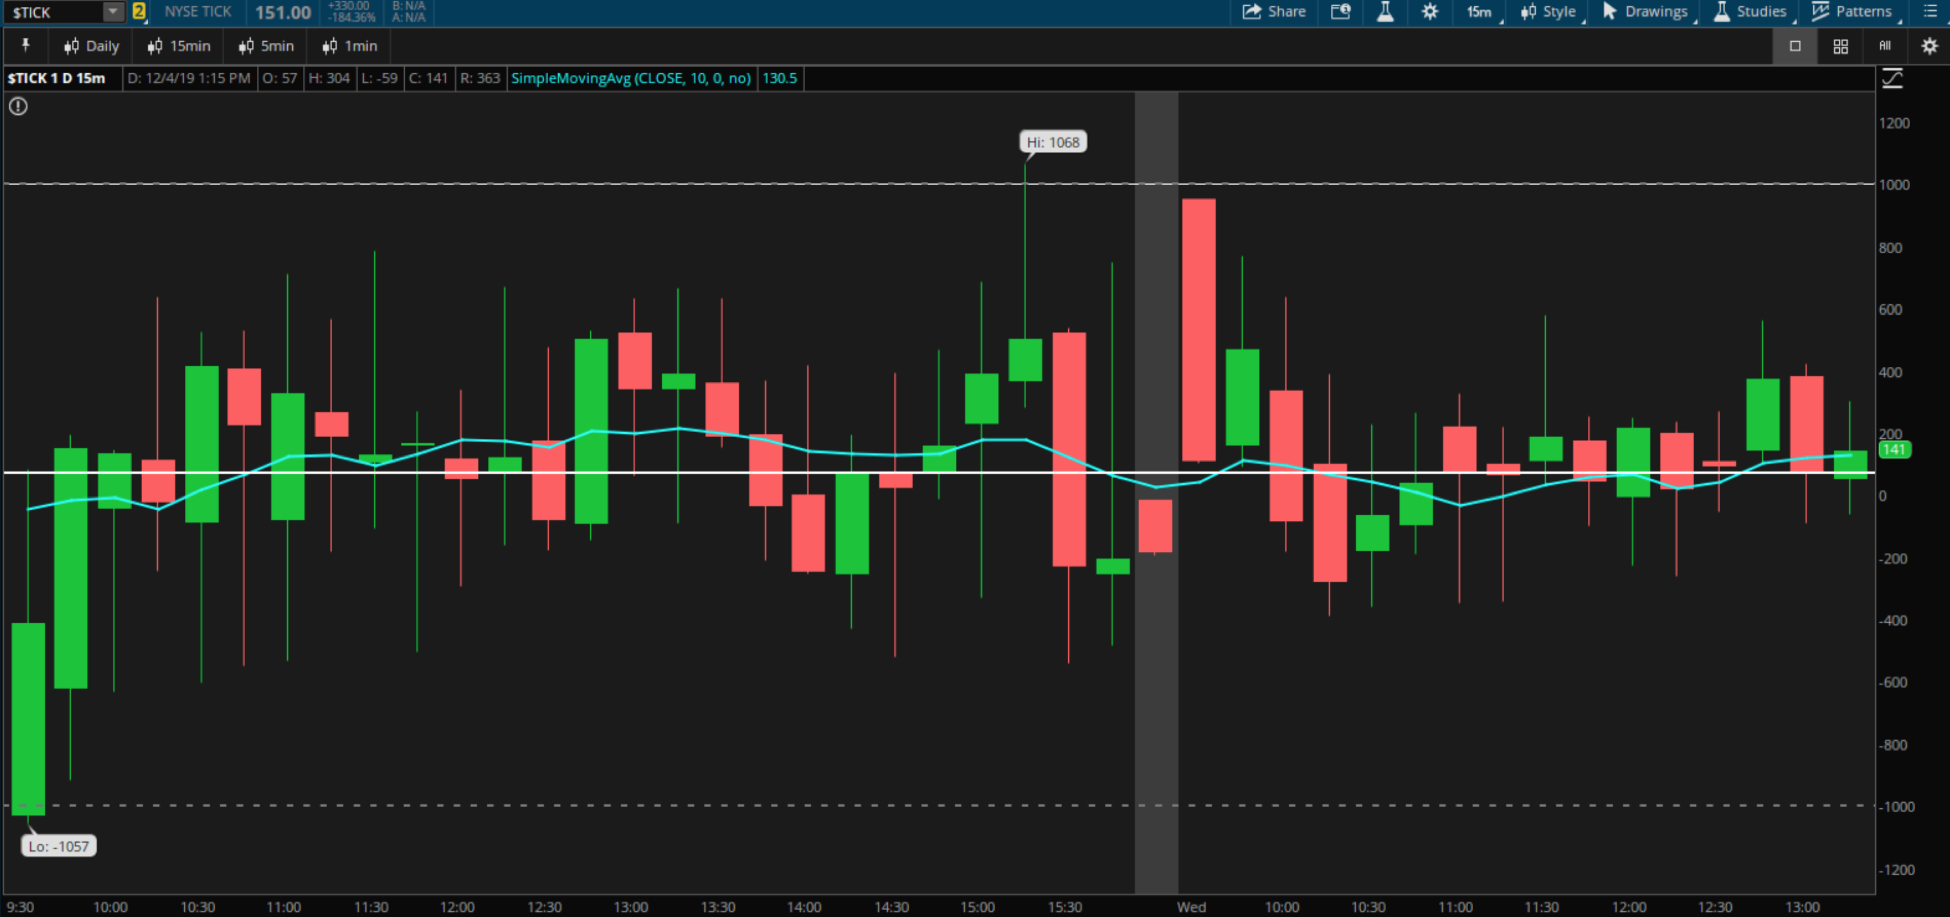
Using the $TICK to determine the day type
Traders like Linda Raschke classify each session of market activity into two components: the first is how the market moves; is price trending or bouncing around in a range, with no discernable direction? The other part is directional: is price action bullish or bearish? Do you think the market will close lower or higher than the open?
Being able to answer these questions confidently makes things much more manageable. For example, on a bullish trend day, you can opt to only look for trend following long setups. This means you’re not trying to fade extremes on either side or take any short trades. It zeroes in your focus onto one type of trade, putting the odds in your favor.
On a trend day, the $TICK will spend the majority of time on one side of the zero line and print several extreme readings in the direction of the trend. Most literature about the $TICK regards the index as solely an overbought/oversold indicator, used to identify and fade extremes. This lacks the context though, when significant momentum and volume are entering the market, extremes are not unusual or necessarily indicative of a trend reversal.
Like the VIX, the $TICK looks more like an ECG than a price chart, so it makes sense to smooth the data, as there’s a lot of noise present. I prefer to use a moving average. If the moving average spends most of the day on one side of the zero line, that should be your directional bias for the day.
Here’s an example of a bearish day. As you can see, the 10-period moving average spent all day below the zero line, indicating that significantly more stocks were downtick for the entire session.
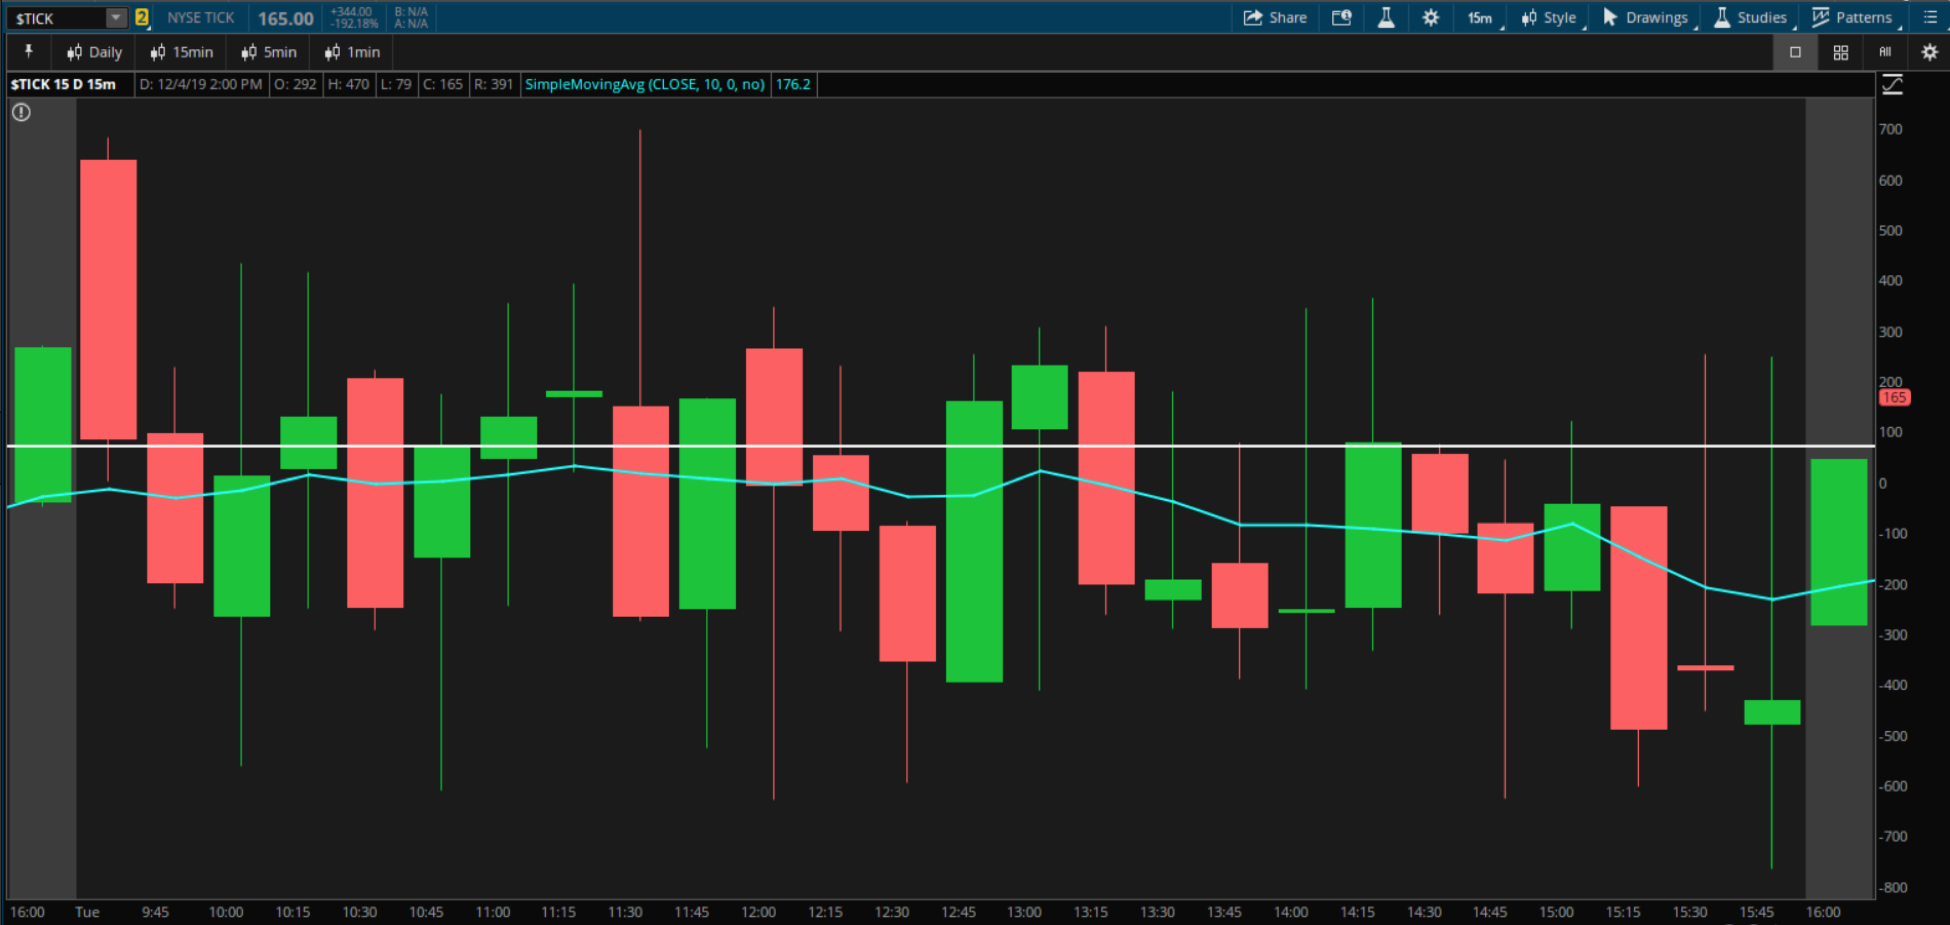
You should note, however, that on the chart above, the $TICK never made any significant extremes (regarded as at least +/-1000) on either side of the zero line, indicating that considerable momentum was not present.
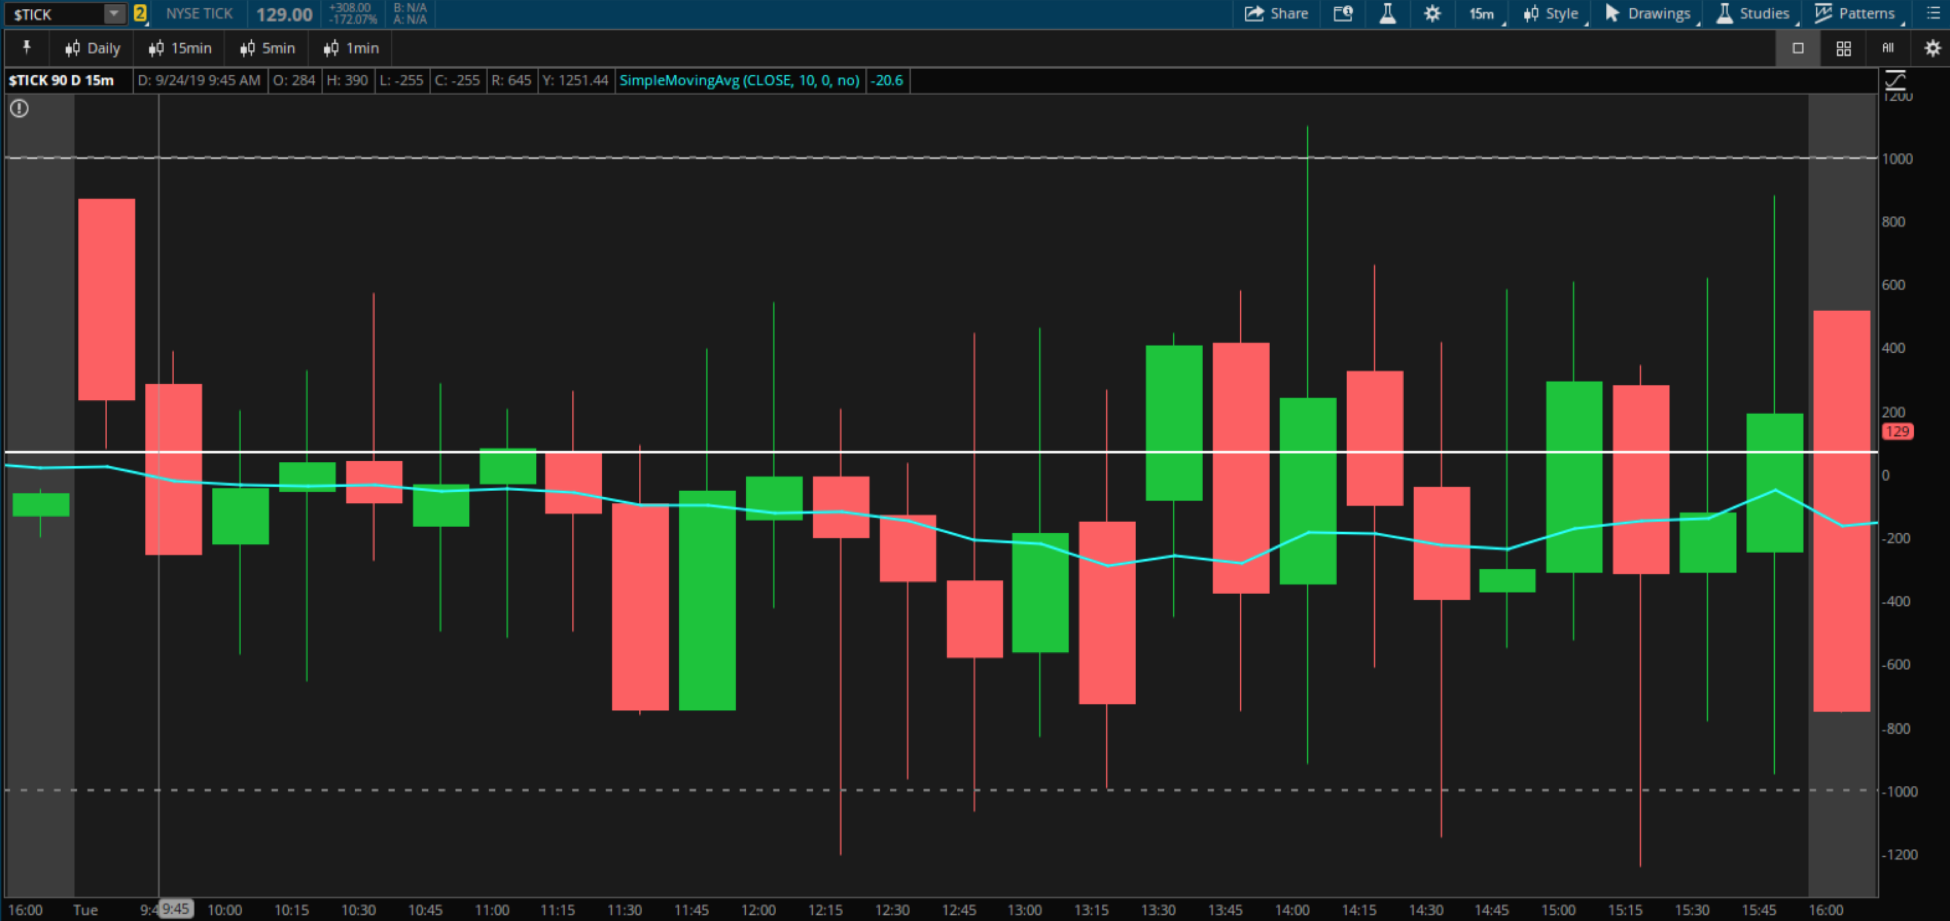
Here’s another example. The directional bias for the day was bearish, owed to the moving average spending the entire session meaningfully below the zero line. You’ll also notice that the $TICK made multiple downside extreme moves that didn’t result in a trend reversal, evidenced by the continued bearish action throughout the day.
Other important market internals
- Advance/Decline Index: Ticker is usually $ADD for most platforms. Calculates the net number of stocks that are up on the day versus those down on the day. Similar to the $TICK index, but it has more utility on longer time frames.
- Volume Breadth: The ticker varies by platform, but it’s $UVOL-$DVOL on Thinkorswim. It calculates the net sentiment of the volume of stocks up on the day versus the volume of declining stocks.
- NYSE Volume: Ticker varies from platform to platform. I don’t know of many who use this outside of Linda Raschke, but anything Linda uses is worth mentioning. She looks at the first 30 minutes of NYSE volume to get a gauge for the day type. If the first 30 minutes of volume significantly exceeds that of previous days, she sees a high probability of a trend day.
Final thoughts
Market internals are all about providing further context beyond price action. Their primary purpose is to answer the questions you should have when you go to trade the markets. They should help answer questions like:
- “Should I be a buyer or seller today?”
- “Is this rally supported by the entire market?”
- “Should I fade extremes or ride trends today?”
- “Is there enough momentum for the market to break out from its multi-day range?”
- “Do the internals agree with my directional view on price action?”
- “Should I be aggressive or conservative with my trading today?”
To summarize, market internals are best used to:
- Look for divergences: If the price is at a high of the day, but internals like the $TICK or $ADD are not at highs, the high is unlikely to hold.
- Look for confirmation: When buying a higher low on a trend day, look for a higher low or at least bullish action on the $TICK.
- As switches to begin or halt your trading: An example would only be trading when the VIX is at least 5% above or below its 10-day moving average.
If you’re interested in learning more about trading futures, be sure to check out our beginner’s resources, including our Beginner’s Guide to Trading Crude Oil Futures.