Adam Grimes is one of the best-known figures in trading media. He’s the author of The Art and Science of Technical Analysis and created a free trading course called The Art and Science of Trading. Adam is primarily a trader of the major futures contracts but will take a trade in any market that presents an opportunity.
Adam’s first foray into trading was through a guru who taught his students to apply Martingale betting systems to agricultural futures. Armed with the guru’s system and his knowledge of agriculture owed to growing up on a farm, Adam thought he had struck it rich. Until he blew up his account. According to Grimes:
“No matter where somebody were to start, you can’t start worse than I did.”
In this post, I’m going to try to compress some of the most significant light bulb moments that Adam’s works have provided me into something you can read in 10-15 minutes. A tall task, I know, but I hope it serves as a starting point for studying this man’s excellent contributions to the trading world.
Adam’s philosophy on markets

Approach to markets: Price action and market structure
The philosophy that guides all of Adam’s market analysis is that “every edge we have, as technical traders, comes from an imbalance of buying and selling pressure.” We shouldn’t trade patterns, but the underlying imbalances that create those patterns.
It’s essential to have a framework for organizing the data the market creates. The framework we build aims to answer questions like:
- Which market data should I ignore?
- On what time-frame does price action cease to be noise?
- When is price action random?
In establishing a framework, it becomes necessary to make arbitrary judgments. Nothing makes the close of a 15-minute bar significant, or the choice to use an exponential moving average over a simple or weighted average. When you break things down like this, the only ‘pure’ way to analyze market data is through single-tick charts, which present more problems than they solve.
Adam’s framework contains two crucial top-level distinctions. Those are: price action is the dynamic movement of the market, and the market structure is the static structure left behind by price action.
Adam described the distinction as:
“Think about a finger tracing a line in the sand. Market structure is the line left in the sand. Price action describes the actual movements of the finger as it drew the line. In the case of a finger, we would talk about smooth or jerky, fast or slow, and lightly or with deep pressure into the sand.”
Most price action is random
Technical traders tend to attach plenty of meaning to each bar or candlestick, agonizing over its relation to others, searching for chart patterns. Adam takes the view that the vast majority of price action in any market imitates a random walk. In these market conditions where price action is random, trading is, theoretically, a zero-sum game. However, in the real world, it’s actually a negative-sum game due to execution errors, commissions, etc.
Taking this view, achieving positive expectancy in your trading is as much about identifying conditions not to trade within as it is about identifying setups where price action is less than random. Adam holds that he’s never encountered a consistently profitable trader who trades a mechanical system with no discretion, and the randomness of price action is the reason why. If a trader doesn’t have a working understanding of price action and market structure, they won’t be able to identify the market conditions to avoid taking trade signals within their mechanical system.
Even though Adam provides trade setups in his book, he refers to them as rough guidelines for identifying conditions where there is sometimes buying or selling imbalances. Because entries, exits, position-sizing, and units to risk per trade are relatively arbitrary, these setups cannot be traded mechanically without an understanding of price action and market structure.
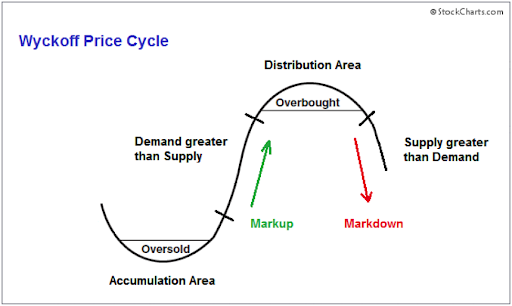
The two states of markets: Trends and ranges
Adam divides market action into two states: a trending state, and a range-bound state. Ranging markets are mostly random while trending markets often exhibit less-than-random price action. Trending markets are usually characterized by a directional imbalance of buying or selling pressure, which is the fundamental driver of our edge in markets. That is, however, not to say that one cannot create profitable trading strategies within ranging markets, as Adam will trade in these environments himself.
Instead of explaining the differences between these two market environments, which Adam and others have done ad nauseam, I’ll highlight two light bulb moments I had in my reading of Adam’s work: identifying the difference between a highly random range-bound market, and an accumulation or distribution zone, as well as how Adam’s insights on trading trend pullbacks helped me create a framework for my pullback trading.
Identifying accumulation or distribution in a range
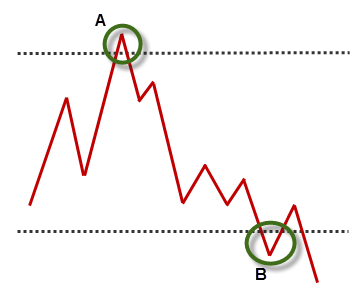
Wyckoff’s idea of accumulation or distribution are market ranges that have some non-random price action within them that can be predictive of a forthcoming trend.
The presence of multiple failed breakouts within a market range can be a sign of a buying or selling imbalance. Wyckoff called these failed breakouts springs and upthrusts, but we’ll refer to them as failed breakouts for simplicity’s sake.
When the market is in a period of accumulation, the theory goes that the ‘smart money’ is quietly buying, careful not to allow the market to break out of the accumulation range. This marks the difference between a random, range-bound market, and an environment with a bit of predictability. During this accumulation period, the market is aggressively bought when it reaches support levels at the bottom of the range. The critical thing to look for here is the spring (failure test), which is a failed breakout that aggressively reverses back into the accumulation range within the same price bar.
Here’s an example (A) of a failure test when a market is in distribution, which Wyckoff called an upthrust.
Qualifying Trend Pullbacks
The trend pullback trade is among the most intuitive trade setups. We both sense and ‘know’ that the trend is your friend due to the wealth of academic research on the momentum anomaly in asset prices. Entering the trend on a pullback appeals to our nature to buy things at a ‘discount.’
Like anything in trading, though, quantifying a pullback is difficult. When does a pullback indicate the termination of a trend? How much do we wait for a trend to pullback before entering? What factors make trend continuation after a pullback more likely?
Applying and understanding Adam’s ideas on trading trend pullbacks helped me turn the corner in my trading. Ever since I read about the Holy Grail setup in Linda Raschke’s Street Smarts, the trend pullback has been my go-to setup, but I’ve struggled with mixed results and inconsistent application. In The Art and Science of Technical Analysis, Adam gave me clarity, and I’ve seen my results dramatically improve.
Most of us are familiar with the classic ABCD trend pattern highlighted in traditional technical analysis texts:
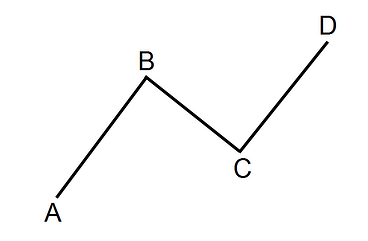
Adam also defines a pullback trade this way, but the additional color he provides on qualifying the setup has been invaluable to me, and hopefully you as well. Below is a distillation of what is a more complex idea on qualifying a pullback setup. While I advocate doing a deep dive on Adam’s books, course, and blog, below can act as a quick checklist.
Momentum
Adam uses a modified MACD (the same 3-10 oscillator used by Linda Raschke) as a momentum oscillator to quickly judge the amount of momentum recorded by a trend leg. He likes to see the MACD make new highs after an upswing in the trend, and will avoid taking the trade if the downswing registers a momentum divergence (a new low on the MACD).
Size of retracement
As a rule of thumb, upswings should be more significant than downswings in an uptrend, both in duration and magnitude of the price move. A retracement that is larger or proportional to the prior upswing at the very least signals that you should lighten up on the market, and may indicate the termination of the trend. In an optimal environment, the counter-trend leg is less aggressive than the previous trend leg.
Loss of Overall Momentum Post-Pullback
This one was pretty instrumental for me. A pullback that doesn’t quickly tell you that you’re right or wrong, where the market has essentially paused and moved into a range, is often a lousy trade. At the very least, it’s a bad use of capital to wait out the market but can also signal trend exhaustion.
Disagreement with big picture trend
If you’re trading a pullback on a 15-minute, but the daily and weekly charts are counter to the 15-minute trend, the failure rate of the pullback increases significantly. In an ideal scenario, your big-picture time frame agrees with your trading time frame.
Support and resistance: More random than you think
Adam has become a polarizing figure in the trading world as a result of him challenging plenty of traditional technical analysis concepts like Fibonacci retracements, the importance of volume, and, most of all: support and resistance.
One of the most eye-opening revelations in studying Adam’s work was his dismissal of support and resistance as it’s explained in most trading literature. Let’s not get it twisted: Adam has both found statistical significance to support and resistance levels and created profitable trading strategies based on these findings, but his ideas on the matter are at odds with conventional wisdom.
He’s explained that most of what traders consider to be support and resistance levels are no more meaningful than any random level. It’s easy to look back at history and find instances where prices cleanly bounce off of support or resistance, but the challenge comes with identifying levels of real imbalance “on the right edge of the chart,” as Adam puts it.
As a consequence of our tendency as humans to find patterns in random data, we will find several levels that look like support or resistance. Price has bounced off of these and traded back into the middle of the range, looking to test the other side of the range.
In the video linked below, Adam performs an exercise to demonstrate the flaw of using support or resistance levels as your primary trading strategy. He hides the price bars and draws random price lines without first seeing the price action. After revealing the price bars, he finds that these random lines often mimic support or resistance. He challenges traders to conduct this experiment on their own, and then compare the significance of the arbitrary lines to support or resistance lines we generate on our own.
The primary point he is trying to drive home is not wholly to dismiss support and resistance levels. Instead, he maintains that traders need an additional reason to trade that indicates a buying or selling imbalance, as these levels exhibit too much bias and randomness.
Here’s a quote from The Art and Science of Technical Analysis to illustrate this further:
“So there is no escaping this truth–if you are buying in front of support or shorting in front of resistance, you must have an edge beyond just having a much larger profit target than stop loss. You must have a reason for expecting nonrandom price action off the level.”
The Art and Science of Technical Analysis
Final thoughts
To me, Adam Grimes represents everything that modern technical analysis should be about. Instead of rejecting the wealth of academic research that stands at odds with many of the ideas of classical technical analysis, he, in effect, became an academic himself and did his quantitative research. From the wealth of his work came many challenging revelations about technical analysis, which fundamentally question the way technical traders have been trading for decades.
Studying Adam’s publishings can serve as a shortcut for many, and it should be noted that his first book, The Art and Science of Technical Analysis, is the distillation of 20 years of market experience and quantitative research. This includes assistance and mentorship from household names like Linda Raschke, Perry Kaufman, Mark Fisher, and Victor Niederhoffer, among many others. Applying the same level of dedication as Adam can literally save you years of your life and a portion of your net worth.
But, more than just learning about markets and technical analysis from Adam, I think there’s much for us all to take away from his discipline as a market practitioner. Reading his piece The Dark Side of Technical Analysis, it made me think of how rare it is that someone entirely dedicates themselves to a subject matter.