I recall my early trading years when professionals with greater accomplishments than myself would comment on the significance of volume. Of course, I understood that remarkable volume indicators existed. Still, it perplexed me that some traders simply looked at the total volume histogram on a chart and relied on detecting pertinent information from such a simple indication.
Moreover, as shown by the primitive indicator reflected on the chart below, volume is subject to many nuances. These include the fact that on this chart, you cannot tell precisely how much volume traded at which prices, nor can you determine how much activity was conducted on the bid side compared to the ask. Therefore, the amount of trades initiated by the buyer or seller is unknown.
However, throughout my career, with a simple bar chart and volume histogram, I began to detect some market patterns that are helpful from the perspective of the short-term scalper, intraday position trader, and the overnight swing trader, which can be applied to all timeframes.
Using volume as a trading indicator
The chart below reflects three-minute bars of the S&P 500 futures contract (ESM3). If you refer to the chart, I’ll outline a simple but effective means of using price and volume to provide a fair indication of market behavior.
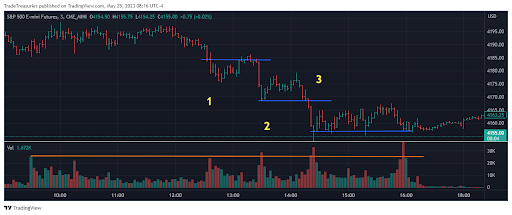
You can see volume bars laid out on the lower pane of the chart. Across the volume bars, there is an orange-colored line that begins at the 9:30 EST regular session open of this market. As you can see, expectantly, volume spiked early on and settled mainly into normal ranges for the rest of the morning.
However, in the afternoon, the market began to experience weakness. Around 12:30 pm, where the number 1 is noted on the chart in yellow, you’ll observe a volume spike nearly matching that of the opening portion of the day. I placed a blue line in the area of the previous bars close and the high-volume bars open.
Volume can signal momentum
Since the market was trending lower, I considered this area to indicate a form of resistance. After all, this marked a pivotal moment before heavy volume flooded in. As we continue to observe, this market traded slightly lower before seeing a modest rally back to the first blue line, where it met resistance and continued lower.
As this market continued lower, you’ll see that a wave of selling pressure made a new high-volume bar, reflected in the yellow number 2 area. Unsurprisingly, with a wave of exceptional volume, the market paused its momentum; however, I marked the close of that high volume bar (#2) in blue, and when the market sliced through that level, it was an ideal opportunity for a brief short position.
Again, as noted by the yellow #3, heavy trading activity created a new volume high as the market was falling with strong momentum. This, in turn, led to a bar that began to potentially look like a bottom formation. I marked the close of that bar to either (a.) short if the market fell back through or (b.) use it as support. Since the blue line from the second example (yellow #2) had just worked well, I’m usually suspicious of it working precisely the same way again.
So instead of looking for shorting opportunities, I looked for that final blue line to hold, which it did. Again, the market used this area as support, providing a chance to secure some fair, quick long trades.
Simple but effective
In these examples, the price action that meets elevated volume is a good pivot marker for denoting support and resistance. Likewise, sometimes this scenario can confirm a trend when the market breaks a range on high volume and then retraces to test the same high volume location, only to continue its direction.
Experienced traders know it will likely require much more than this simple mechanism to develop a comprehensive trading system that produces robust results. However, with a proper risk-to-reward ratio, this is one way to approach the markets in a way that increases your opportunities for success.
Combine this information with your current tools, trade responsibly, and see where it takes you.
Until next time, trade well!