Home › Market News › Basics of Support & Resistance
The definitions of support and resistance are straightforward enough; support is an area where more aggressive buyers meet sellers, and resistance is an area where more aggressive sellers meet buyers. The question is whether or not their roles will reverse when the area is violated, i.e., will resistance become support?
One way to get started doing this is by having a good understanding of the importance of trends. Simply put, in technical analysis, the trend is the longer-term direction the market is moving.
The basic concepts of trend are fairly universal; there are only three directions a market can be moving:
That’s it.
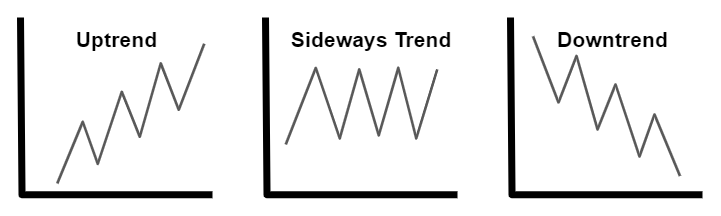
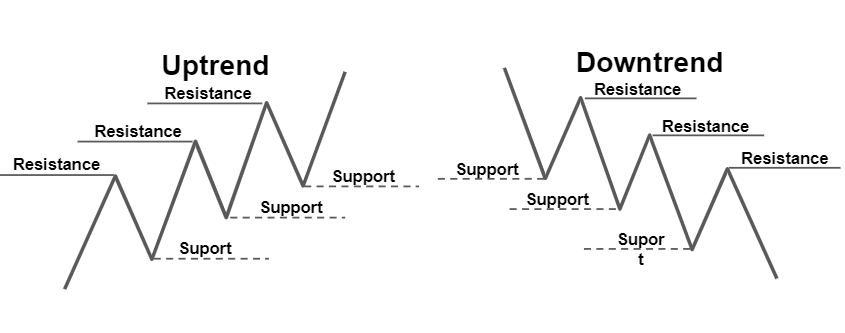
A market trending higher, or an uptrend, is identified by a series of higher highs and higher lows. Inversely, a market trending lower, or a downtrend, is identified by a series of lower highs and lower lows. Lastly, a sideways, or flat market, is identified by a series of highs and lows moving horizontally across the chart.
The majority of the chart patterns we discussed in the Topstep Trading 101 blog series have direct correlations to the trend’s direction. The trend is the backbone of technical analysis. It is a key component to a wide range of trade entry and exit strategies.
Support and resistance play an important role in determining the direction of the underlying trend and can also be used as a leading indicator of a change in trend. Let’s take a quick look at uptrends as an example.
As stated above, an uptrend is characterized by price moving upwards in a series of higher highs and higher lows. For the uptrend to continue, a pullback should not move lower than the previous support level, and the subsequent rally must move higher than the previous resistance level.
A pullback that moves lower than the previous support level is an early warning sign of a possible shift in trader sentiment. If the price then fails to take out the previous high before meeting more resistance, then the red flags will start flying, and traders will begin looking for a change in trend.
The same concept applies to downtrends. When a previous support level holds, and a previous resistance level is breached, the market fails to make lower lows and lower highs, and a shift in trend must be considered.
Another key point to mention is that trends rarely change directly from up to down or down to up. If a healthy new trend is forming, the market will spend some time in consolidation, or a sideways trend, before making a new directional shift.
In a perfect world, support will become resistance, and resistance will become support once the levels are violated. A popular belief among traders is that a prior resistance level being breached indicates that sellers have failed to protect that level from buyers, and a shift in balance is taking place.
These levels are considered to hold a great deal of psychological significance for traders. And because buyers fought so hard to overtake a level from sellers, they will, in turn, protect it with the same strength in the event a retest of the level occurs. It is at this point where resistance theoretically has turned into support.
Unfortunately, we don’t live in a perfect world, and most of the time, a resistance area becomes another former area of congestion. However, if the market recently spent a lot of time jockeying back-and-forth at that level and volume was on the heavy side, then it’s possible traders will hold it as a psychological level of support if the area is retested within a certain time frame and try to protect it.
So, while resistance can become support, it is not an indisputable truth. The reality is, we never know if it really is a new support level until after the fact. The same holds for new resistance levels. There’s no guarantee that a former support area will become a future resistance area.
Again, watch for extreme volume, how long the market spent at the congestion area, and how recently it happened to gauge the level’s probability possibly holding as resistance. Let the market do its thing, don’t try to fight it.
Trade well!