By Daniel P. Collins
Many popular market indicators are criticized as being “lagging indicators” that tell you what the market has done but may not be able to project where the market is heading. On-Balance Volume (OBV) has the advantage of using current volume data to predict where the market is headed. It is, therefore, a leading indicator.
OBV was created by Joseph Granville and introduced in his book, “Granville’s New Key to Stock Market Profits.”
Volume is an important data point for technicians to look at whether you are utilizing the OBV indicator or not. In addition, many technical trading systems will use volume as a filter in making trading decisions. The notion is that any significant move in a stock or underlying market needs to be validated by sufficient volume. This is particularly important when trading less liquid instruments, or moves that occur during overnight or low-volume environments.
But Granville, in his 1963 book, takes the study of volume further. Granville’s core principle is that “Volume has a tendency to precede price.”
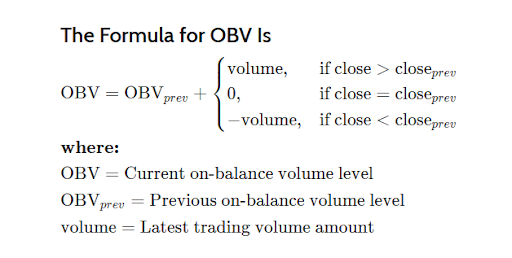
The OBV indicator attributes all the volume on an up day positively and all the volume on a down day negatively. It is cumulative so that every day a market moves up, that day’s volume is added to the indicator or subtracted from it in case of a down day.
The formula
When OBV increases without a corresponding increase in price, it is a signal that the price is preparing to move higher.
Source: Investopedia
Granville notes, “The usefulness of stock price charts can be greatly advanced by the addition of the OBV measurement. OBV can be a particularly effective ‘early warning’ of future price movements, more effective than relying wholly on price movement itself.”
In his book, Granville maps this out. On Monday, a stock rallies, volume is 10,000 shares of what he calls “upside energy,” creating an OBV of 10,000. On Tuesday, the stock falls the same amount on volume of 5,000 (downside energy), making the OBV 5,000.
“The casual observer sees that the stock price at the close of Tuesday’s trading had made no progress since the Friday close,” Granville writes. “This observation is right in terms of price but is WRONG IN TERMS OF VOLUME (emphasis is Granville’s). Something has changed. There is a net of 5,000 shares left on the buy-side. This residual is the OBV, the technical strength the stock has added between the Friday close and the Tuesday close. In other words, the stock is technically stronger (a better buy) at $8 on Tuesday than it was at $8 on Friday.”
In his example, the stock rallied on the third day, creating a new high in OBV and signaling an uptrend in the market, which paid out in a large move on day four.
This is the basis for Granville’s analysis, which is that changes in volume are predictive of changes in price.
Putting it into practice
Bramesh Bhandari wrote, “The basic assumption regarding OBV analysis is that OBV changes precede price changes. The theory is that the flow of the smart money can be seen by a rising OBV (See: “Trading under pressure with on-balance volume,” Futures February 2014).
The key to a buy signal is a series of higher highs and higher lows in the OBV indicator, or lower lows and lower highs for a sell signal.
At the end of March, the OBV in crude oil made a series of higher lows after setting a low on March 20. When OBV took out its high on March 31, a buy was signaled (see chart below).
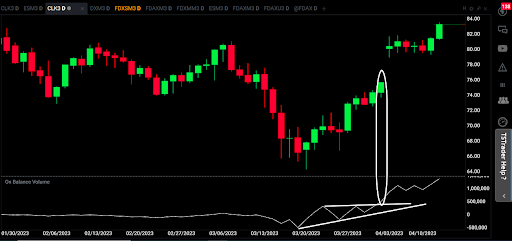
As you can see, crude oil spiked higher after OBV set a new high.
As with many indicators, the strongest signals are often when there is a divergence from price. Recently OBV indicated a buy in the E-mini S&P 500 (see chart below).
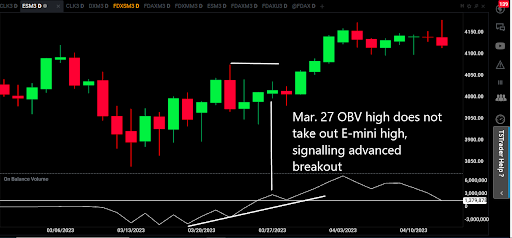
As you can see, similar to the crude oil example, OBV made a series of higher lows followed by a higher high. The higher high in OBV on March 27 is not accompanied by a new high in the E-mini. This is called an advanced breakout and is a strong buy signal.
Accumulation and distribution
Key to OBV, according to Granville, is the detection of periods of accumulation and distribution. “[OBV shows you] how to measure volume more effectively and to use these measurements to detect the presence of accumulation and distribution patterns,” notes Granville.
“The most important thing to learn in the technical approach to stocks is how to tell the difference between accumulation and distribution. Accumulation is buying, which does not immediately reflect in a price advance; the greatest price advance occurs after accumulation has taken place. Distribution is selling which takes place without visible signs of price weakness.”
The beauty of Granville’s work is not only the use of volume as an indicator but also the observation that volume tends to move ahead of price, creating a stronger predictive value.
Granville believes that every indicator used on the price of a stock or underlying instrument can also be applied to volume. Based on his theory that volume precedes price, Granville writes, “We can therefore put more stress on the OBV line: A volume breakout, volume support levels, volume gaps, and volume-based formations knowing these things have a strong tendency to precede the same things in terms of price.”
Granville did not only provide a solid leading indicator with OBV, but also opened an entire world of technical analysis by showing that every indicator applied to price can also be applied to volume.