Get to know the basics of auction market theory
Financial markets are an endless two-way auction, where the price is discovered through the negotiation of buyers and sellers. The stock and futures markets, like any market, exist to facilitate trade. As a result, markets seek to reach a state of balance, where there is a relative agreement between buyers and sellers.
In this balance of supply and demand, the notion of value arises. Not value in the traditional value investing sense, but the idea that there are ‘fair’ prices, where buyers and sellers agree, and ‘unfair’ prices at which the market quickly moves away.
This is known as auction market theory and is the underlying philosophy behind many wealthy traders. Most practitioners of auction market theory find trade opportunities by trading the imbalances of supply and demand. They will fade unfair prices when they sense that there isn’t enough conviction to change value and trade in the direction of unfair prices when there is enough momentum to establish a new value area (this is how auction market theorists view market trends).
When the subject of auction market theory arises, most think of market profile and tend to equate the two, but they’re different things. Auction market theory is the underlying philosophy that drives the decisions of most traders who use market profile, while market profile is simply a tool; a means to organize market data.
What is auction market theory?
Auction market theory is a philosophy for observing and trading the financial markets. The cornerstone of the philosophy is that price and value are distinct from one another. Auction market theorists are kind of like the value investors of the short-term trading world. While value investors declare the value of a company based on their financials, auction market theorists establish value through observing the prices where price:
- Spent the most time.
- Did the most business (volume).
- Presented the least contention between buyers and sellers.
If auction market theorists can establish value, they can begin to formulate a trading plan.
To simplify this idea of value further, you can categorize market behavior into two states: balance and imbalance. When markets are balanced, there’s a sense of consensus. The market isn’t making any dramatic price moves, and most volume is being executed within the value area. There isn’t enough conviction on either side of the market to push prices in either direction.
A period of imbalance occurs when one side of the market (buyers or sellers) shows more aggression and pushes the price in one direction. During this imbalance, the market is testing several different prices, looking to find value once again. An axiom in AMT is that imbalanced markets seek to restore balance, so the imbalances hardly last for extended periods.
In a nutshell, auction market theory is a framework for observing financial markets that aim to identify imbalances. The actions of the AMT trader here are typically twofold:
- Enter in the direction of the imbalance if the market is exhibiting momentum
- Fade the imbalance if there is a poor conviction
What is a market profile?
Market profile is a method of visualizing market data. Unlike a traditional bar or candlestick chart, which prints a security’s open, high, low, and close for each time-period, market profile graphs display that and much more: namely, time and volume at a price.
Market profile charts are typically used by traders who follow the principles of auction market theory. Consequently, most market profile charting platforms are developed with those principles in mind.
As mentioned earlier, the market profile is the most efficient way to organize market data for auction market theorists. Your typical market profile chart is designed as follows:
- X-axis: Represents time
- Y-axis: Represents price
- Each letter or symbol: Represents a TPO (time-price opportunity), indicating the market had the opportunity to trade at that price during a specific period
- Value Area: Often plotted automatically
- Point of Control (POC): Typically marked automatically
Key market profile concepts
TPO (Time-Price Opportunity)
A TPO or time-price opportunity is simultaneously the most basic and confusing concept in market profile nomenclature.
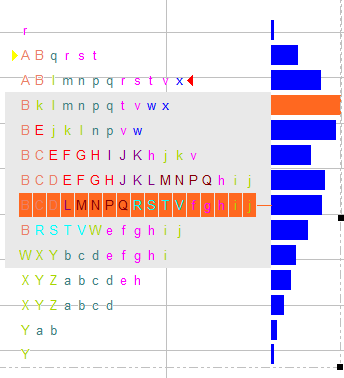
A TPO refers to the ability to transact at a given price during a specific time period. Each time the market reaches a new price, a new TPO is created. On the majority of market profile platforms, TPOs are represented by letters. If you look at the chart below, each letter on the chart represents a unique TPO.
Value area
When the local grocer priced his peanut butter below value in the “peanut butter extravaganza,” the consumer bought in a frenzy, leaving in its wake a single-print buying tail.
-Jim Dalton, Mind Over Markets
The value area is essentially the “initial balance” it’s the area where price has spent the most time and done the most volume. Value areas are always bound to change, but as a generality, price tends to prefer to return to the value area unless significant momentum is present in the opposite direction.
The value area is conventionally plotted as the area where roughly 70% of trades took place. This 70% number is taken from the statistical concept of the normal distribution. While financial markets seldom exhibit normal distributions on either side of the mean, a bell curve is a convenient method of organizing the data.
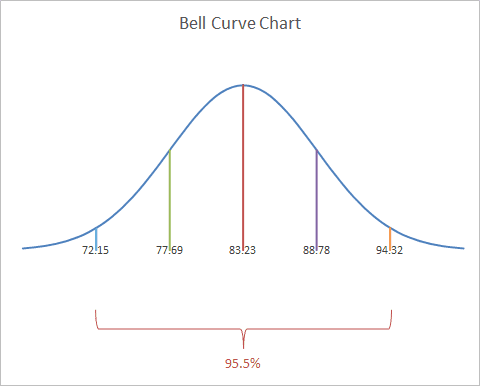
Here’s an example of a session with a close-to-normal distribution:
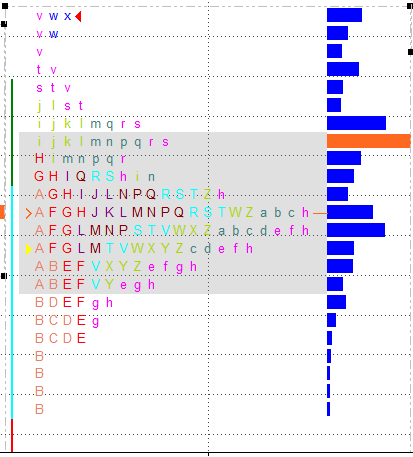
As you can see, the value area (highlighted in grey) represents the first standard deviation of prices. The above session actually resembles a bell curve.
At the beginning of this quote, the Dalton quote quickly gets to the essence of value without the use of jargon or trading concepts. Let’s take a similar example. At my local grocery store, chicken breast costs about three dollars per pound. When the grocer has too much inventory and puts them on sale for $1.50 per pound, the inventory is quickly bought up, bringing the price back to $3.00 when the store restocks. The grocer realized that $3.00 is the efficient level to price the chicken breasts at; if he prices it too far above $3.00, there are not enough buyers. Too far below, and his inventory is bought up too quickly. This simple supply and demand concept is the underpinning of the value area concept in auction market theory. If you can grasp this, you’re halfway there.
Point of control
The point of control (POC) is the price in the session where price spent the most time and is closest to the center of the value area. Jim Dalton, the godfather of market profile and auction market theory, refers to the POC as the “fairest” price at which to trade.
The POC should serve as a point of reference to form this heuristic: If I’m buying (selling) above (below) the POC, the odds aren’t typically in my favor. What is different now? Essentially, during a rotation day, trading against the direction of the POC is generally a losing proposition.
I view the POC as an extension of the value area. It’s the quickest reading you can get on a market, kind of a “thin slice” reading of market behavior.
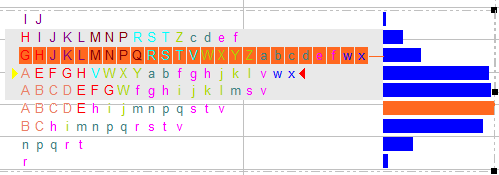
Here’s an example of one way you’ll see the POC marked in a market profile. The chart below is from the MultiCharts platform. I choose to highlight the entire TPO in orange, but many platforms will market the level with a line, arrow, or something else.
Day types
In general, there are two-day types in modern market profile and AMT thinking. There are range days and trend days. In a nutshell, a range day is marked by a lack of directional conviction from either side of the market, while a trend day is marked by continuous directional price movement.
Within these two distinctions, there are several variants, and each market profiler categorizes them differently. The key concept here is that there’s a certain mode of activity for a range day and a different one for a trend day.
On range days, you’re typically trading a mean reversion style. You’re looking to fade deviations from the value area. On trend days, you’ll typically trade a trend-following style, looking to enter on a breakout or pullback and ride the market for all it will give you.
In future articles, we’ll go deeper into the nuances of determining the day type and how to use that information.
Further study
This article is meant to serve as a friendly introduction to auction market theory and market profile concepts. It took me so long to actually learn these concepts myself because I think the available material is too ridden with jargon and assumes a rudimentary understanding of the concepts. So, I hope this introduction serves as a great jumping-off point, but by no means is it exhaustive. Here are a few resources I recommend to learn to continue your market profile education
Books
The perennial market profile book has to be Mind Over Markets by Jim Dalton. As I’ve mentioned throughout this article, Dalton is the grandfather of market profile.
Aside from serving as a great introductory text to market profile, the first few chapters of the book are one of the most illuminating observations into the true purpose of the marketplace and market participants’ psychology.
After Mind Over Markets, the next logical choice is Dalton’s Markets in Profile, which serves as a deeper guide to trading with market profile than its predecessor.
Of course, no discussion of auction market theory and market profile is complete without mentioning J. Peter Steidlmayer, the man who basically created market profile. His first book was financed by James Dalton, who saw young Steidlmayer’s talent early. Steidlmayer’s most popular book is Steidlmayer on Markets.
Final thoughts
In all of my discussions with traders who do not employ market profile in their trading, their main gripe has been the jargon and confusing-looking charts. My goal with this article has not been to teach you how to trade with market profiles, but to teach you enough to understand what a guy like Jim Dalton is even talking about. At least then you can judge whether he’s worth listening to.
Let us know what market profile concepts you’d like covered on the blog!