Home › Market News › Using Market Correlations To Identify Trend Reversals
Trading currency and futures markets are not supposed to be easy; otherwise, everyone would be doing it. No matter how time tested our particular trading systems are, our risk management qualities have us continuing to improvise while looking at the “what ifs” of market behavior and analysis. The goal of continual improvement and self-awareness is that we identify our weaknesses before the market exposes them to us.
Likewise, traders are looking for an edge and more tools to add to the box. You may be a veteran trader who is continuing your market education, or a newer trader who is trying to ascertain as much information possible.
One of these edges that I’m going to talk about today is probably most appropriate for swing traders, but can be useful and applicable for shorter-term traders who engage in the U.S. futures or currency markets as well.
This edge in focus today is a correlation of markets, particularly in this case, a futures market with a currency pair. There are multiple U.S. Treasury interest rate futures products available, most notably the 10-Year Treasury Note future (ZN) and the 30-Year Treasury Bond future (ZB). These products heavily coincide with the Federal Funds Rate, which is determined by the U.S. Federal Reserve Bank. Additionally, these products are often considered a risk on/off barometer, as these markets underlie a fixed income market.
What this means, is that those who buy the actual U.S. Treasury bonds and notes (not the futures contract which is predictive) receive a certain payout given the interest rate at that time. The duration of the bond would be 30 years, and the note might be 10, 5, or 2 years. When the economy is perceived to be more at risk, generally, so will the stock markets. Therefore, investors will go to a fixed income product such as Treasury products, which offer a small, but precise payout rather than the uncertain growth of the stock market.
Because of the nature of these products, they are heavily tied to the underlying currency; in this case that would be the U.S. dollar. However, the worth of a currency, such as the U.S. dollar is relative to the market it’s trading against. One variable would be the underlying economy and interest rate of the currency paired against the dollar.
When it comes to the correlation of U.S. Treasury futures, the most heavily correlated market over the duration of time tends to be the U.S. dollar against the Japanese yen (USD/JPY). When the price of the 10 Year Treasury Note future is rising, it means that the interest rate of the asset is falling. Accordingly, The interest rate will generally move in the same direction as the currency. So, in the case of the ZN and the USDJPY, the correlation will be inverse. As the ZN rises, the USD/JPY will be falling.
Some of this may be understandably challenging to grasp on the first read, however, a visual will be most helpful. Consider the chart below, on the left, is the ZN and the right is the USD/JPY both on a daily candle frame since mid-January. You will be able to detect the reverse correlation of these markets.
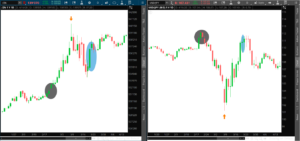
Now, what is really important is how all of this applies to your trading. Identified on the chart are three areas, one noted by a grey shadow, another by a light blue circle, and once more by an orange arrow. From these examples, you might see how a nuanced divergence of the correlation could assist your assessment of each market.
Let’s say you are a USD/JPY trader, the first noted area marked by the grey shadow highlights this recent February 20 – 24. The USD/JPY began to rise first, which in turn would have been confirmed if ZN started to sell off, but rather the ZN started to rally as well, creating a negative divergence on 2/24 the ZN gapped higher while the USD/JPY printed a red bar. This lower close might have been seen as an excellent opportunity to trade a USD/JPY reversal, which has strong follow-through.
The next example is the orange arrow from March 9th. Notice the USD/JPY printed a new low, however at the close; the bar didn’t look particularly indicative of a reversal. However, on the ZN chart, the same day printed a shooting star candle, which was the signal that a reversal in ZN was pending. If you were trading the USD/JPY watching the ZN, you would have looked for follow through on the ZN to signal to buy in the USD/JPY.
Finally, on the blue shaded circle, the ZN, which had been trading weaker suddenly reversed with a strong higher close, meanwhile the USD/JPY began to print a series of doji candles. These dojis were giving an indication that as ZN was rising, that the USD/JPY was poised to take a leg lower, which it did just a few days later.
In conclusion, correlations such as this are never perfect, nor are they a system unto themselves. However, you likely already have multiple useful tools that you utilize, and having an additional analysis to implement could give you that extra edge you’ve been looking for.