Home › Market News › Volatility-Adjusted Risk Management & This Years Big Winners and Losers
The Economic Calendar:
MONDAY: Empire State Manufacturing Index, Raphael Bostic Speaks, Neel Kashkari Speaks, 3-Month Bill Auction, 6-Month Bill Auction, Thomas Barkin Speaks, Treasury International Capital
TUESDAY: Loretta Mester Speaks, Retail Sales, Raphael Bostic Speaks, Industrial Production, Business Inventories, Housing Market Index, 52-Week Bill Auction, John Williams Speaks, Lorrie Logan Speaks, Raphael Bostic Speaks
WEDNESDAY: MBA Mortgage Applications, Housing Starts and Permits, EIA Petroleum Status Report, 4-Month Bill Auction, 20-Yr Bond Auction
THURSDAY: Jobless Claims, Philadelphia Fed Manufacturing Index, Philip Jefferson Speaks, Existing Home Sales, Lorrie Logan Speaks, E-Commerce Retail Sales, Leading Indicators, EIA Natural Gas Report, 4-Week Bill Auction, 8-Week Bill Auction, 10-Yr TIPS Auction, Fed Balance Sheet
FRIDAY: John Williams Speaks, Quarterly Services Survey, Jerome Powell Speaks, Baker Hughes Rig Count
Futures Expiration and Rolls This Week:
There are no expiration or rolls this week
Key Events:
Stock indexes were mixed for the week. The S&P 500 was lower -0.25%, and the Nasdaq index was higher +0.66%.
With such a small number of stocks driving the S&P 500 performance (+7.6% YTD), the situation is a nightmare for active fund managers. Unfortunately, it is also the case that with many investors positioned for a slowing economy, the pain trade has been a rising stock market.
The Russell 2000 year-to-date return is a lackluster-0.94%, compared to the high-flying Nasdaq 100 return of +22%.
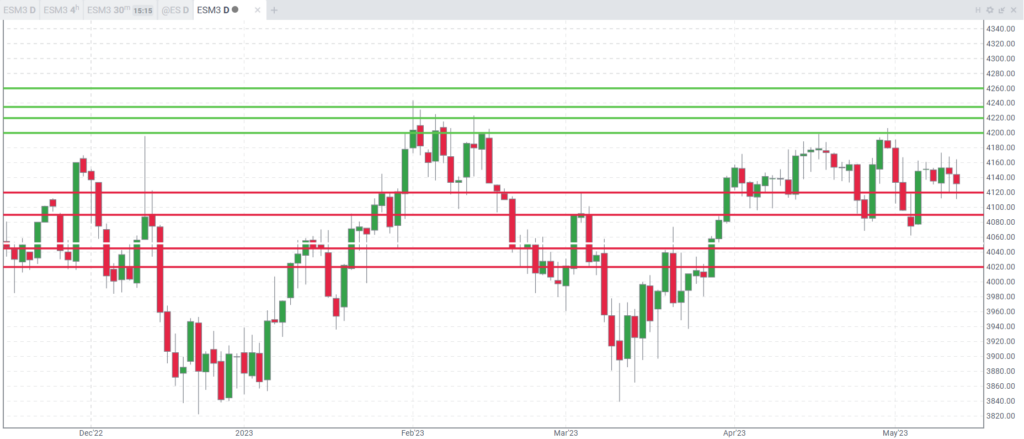
A few key short-term levels for the S&P 500:
Upside: 4200,4220,4235,4260
Downside: 4120,4090,4045,4020
Inflation remains elevated, and lingering banking-sector stress is making the macro outlook uncertain for Fed officials.
Speeches from Fed officials will help assess if a final rate hike is still on the table for June. Chair Powell and President Williams will speak this week.
Are traders predicting the peak in interest rates prematurely? Our thoughts:
U.S. Treasury yields compared to the last newsletter:
30-Year yield 3.79% vs. 3.75%
10-Year yield 3.47% vs. 3.44%
5-Year yield 3.45% vs. 3.41%
2-Year yield 3.99% vs. 3.92%
2-10 Yield spread -0.52 vs. -0.47
The debt limit deadline is quickly approaching. As a result, we expect the market volatility to increase if no agreement is inked in the coming weeks.
Is the U.S. heading for an ‘economic and financial catastrophe’? These were the words used by Treasury Secretary Janet Yellen last week when describing the risks surrounding the looming US debt limit.
Despite all the talk about a potential default, a debt limit impasse poses a downside risk to interest rate yields – either the x-date passes without resolution, or a solution entails significant spending cuts.
The downward trajectory of the dollar index has stopped. As a result, the DXY futures had an upside breakout last week.
Many macro traders and CTAs are massively short, and there is potential for more pain and stop-losses to the upside.
An interesting key level is around 102.75 and is the next upside target. Moving above that area would open the door for further upside potential.
The close risk now is a move back below the 102.40 level. Staying above this level is more bullish, while a move below is more bearish.
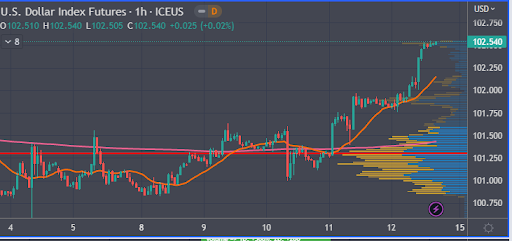 Source: TradingView
Here is s snapshot of the biggest winners and losers this year by asset class, produced by BofA.
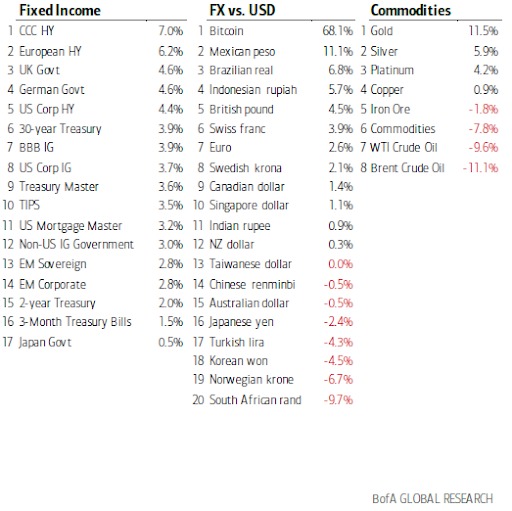
This performance chart tracks the daily, weekly, monthly, and yearly changes of various asset classes, including some of the most popular and liquid markets available to traders.
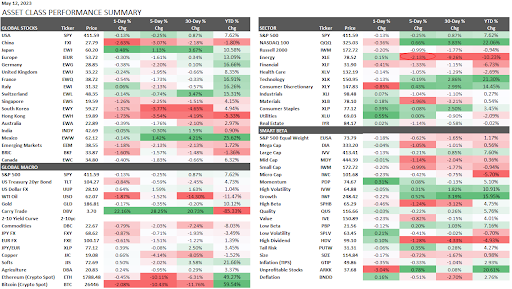
Sometimes traders get caught up in thinking that all risk is the same. On the contrary, a fundamental principle in trading risk management is that the potential for higher returns comes with higher risk.
For example, one (1) contract of Dollar Index futures has a much different risk (volatility) profile than one (1) contract of Natural Gas futures.
Our rule is to use volatility-adjusted trade risk management to ensure we are not taking too much risk.
High Risk (volatility) = Higher Potential Returns
Low Risk (volatility) = Lower Potential Returns