Home › Market News › The Beauty & Simplicity of Moving Averages: Trading System Building Blocks
When discussing the numerous and varied market indicators technical traders use to build trading systems, we often point to moving averages. The moving average is one of the basic tools in technical trading.
It is one of the main building blocks in technical system building. Many of the most basic systems are based on the moving average crossover. Momentum traders will test various combinations of a slower and faster moving average to get a picture of market momentum. This usually involves a simple moving average (SMA), though some traders prefer the exponential moving average (EMA).
SMAs combine the price data of a market over a designated period of time and divides that total by the designated period. For example, a 10-period moving average will add the closing prices of a specific market over the 10 previous periods (this could be a day, week, month, one-minute, five-minute, one-hour, etc.) and then divide that total by 10. The EMA is weighted to give more credence to recent prices. While the EMA uses a specific formula, there are numerous forms of weighted moving averages and some traders like to build their own formula. Whether simple or exponential, moving averages present a smoothed line of recent market activity.
When you place a slow and fast SMA on the same price chart it will provide a picture of market momentum. A basic system can be to put a 10-period moving average and a 20-period moving average on a price chart and wait for the fast SMA (the 10-period in this case) to cross above or below the slower moving average to signal a trade. If you put this up on your screen you are likely to see examples of this working and perhaps some when it doesn’t work (see chart below).
This is extremely basic and not likely to work on its own over time. However, this gives you an understanding of how it works. When the fast moving average crosses above the slow moving average it is an example of upward momentum, when it crosses below the slow moving average, it is a sign of downward momentum.
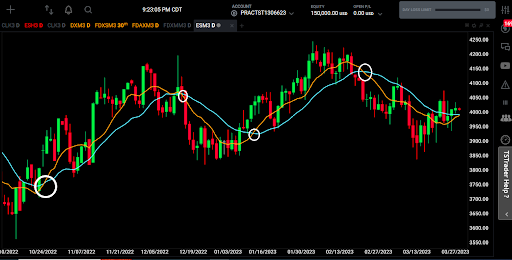
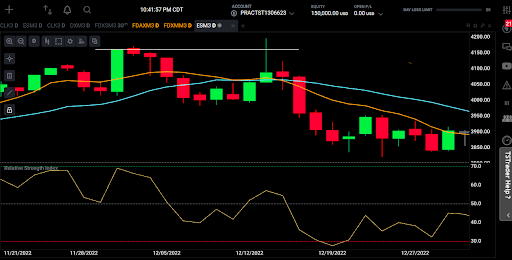
The chart above is of the e-Mini S&P 500 showing recent activity with a 10-day (orange line) and 20-day (blue line) SMA. There are four distinct moving average crossovers (white circles) on the chart, two bullish and two bearish. The first cross occurs on Oct. 25 and appears to launch a successful long position.
The second cross, Dec. 14, is a bearish cross and the start of a significant downward move. The third cross is bullish and occurs on Jan. 12 at the beginning strong up move. The fourth cross occurs on Feb. 22 and is bearish.
While at first glance this seems too good to be true, a closer look shows that three of the four positions that would have been initiated based on the crossover would have been under water at some point and one of those most likely would have been stopped out (see chart below).
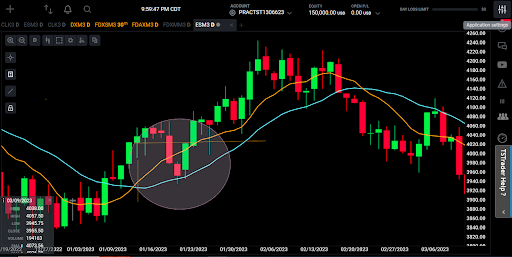
As you can see, the cross was confirmed on the Jan. 12 open. After a slight move higher, one week after the entry the S&P 500 moved close to 90 points lower before breaking out. While this signal led to a strong upside move, many trades initiated after the long signal would have been stopped out at this point.
When applying this to a market, a technician is likely to search through many combinations of fast and slow MAs before coming up with what works best. From there a technician can add rules to his system that would improve the overall performance (see Sidebar: “What is Optimization”).
Volume is often an important filter to technical trading strategies. There are various ways to look at volume but one of the most popular is to ignore any signal when it occurs with relatively low volume. If a move occurs with very low volume, there are reasons not to trust the move as much as if it occurred with robust volume. Systematic technical traders believe price dictates market moves, prices is created by trading activity so the more trading activity (higher volume) there is, the more valid that price signal is.
One simple rule could involve using a longer-term SMA to indicate the broad market trend. If we are using a 10- and 20-period SMA for our fast and slow MAs, we may also put up a 50-period moving average and only take long trades when the market is above the long-term MA and short trades when it is below it.
Another factor is overall trend. Many technical traders will use longer timeframe inputs to validate trades. If, for example, they are trading off of a five-minute chart, they will look at the 30-minute or hourly chart to confirm that they are trading in the direction of the broader trend.
Welles Wilder, the man who designed the Relative Strength Index, identified five things that the RSI tells traders. They are tops and bottoms, chart formations, failure swings, support and resistance and divergence.
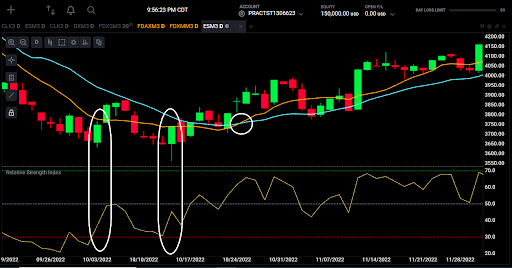
The RSI produced two failure swings on the S&P prior to the Oct. 25 cross. The first failure swing was confirmed on Oct. 3, a day after the RSI fell back into oversold territory but failed to take out the low (see chart below). Some technicians would take this as a standalone signal as the market railed the following three days, or wait for a moving average confirmation.
The second failure swing is confirmed on Oct. 17. In both cases the market made a new low but the RSI failed to make a corresponding low, which is also a sign of divergence. One week after the second failure swing, the long signal was confirmed with the MA crossover.
The Dec. 14 bearish cross has two confirming signals. Once again there is a failure swing in the RSI. However, the failure swing is not confirmed until Dec. 15 after a majority of the move (see chart). A stronger confirming signal is that the e-Mini took out the contract high from Nov. 30 on Dec. 13, but then closed below it (see top line on chart). This is a solid bearish indicator that would be confirmed with a bearish cross the following day.
Knowing which indicators and technical tools to use to validate successful trades based on a moving average crossover is a long process that requires a great deal of research and testing. Legendary trader and co-creator of the turtle trading experiment William Eckhardt requires 1,800 examples of a specific set up to take a trade. Position sizing and stop placement plays a big role because it determines how much risk each trade can take. As noted above, three of the four successful breakouts we highlighted went negative early on. How big you trade and where you placed your stops would make the difference between winning and losing trades.
It is easy to get excited when looking at how successful moves are triggered by a moving average crossover, but technicians must look closer to see how much heat a trade can withstand before ultimate success. Just take a look at the current hourly crude oil chart (see below).
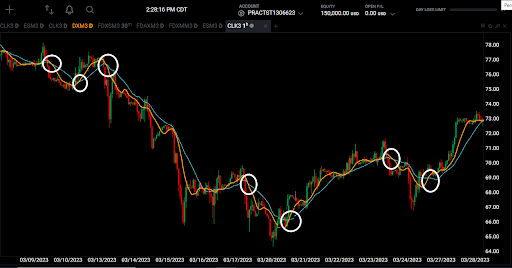
The chart shows numerous successful crosses of the 10-hour/20-hour SMA. The bad news is that it likely is not as easy as it looks; the good news is that it is a solid building block for a successful strategy.
Optimization is one of the most important and most hazardous parts of system building. Important because it is vital to improve your system— a simple moving average crossover with a couple of additional rules cannot stand on its own in the long-term—and hazardous because there is the risk of curve fitting, or as William Eckhardt would say over fitting.
Once a technical trader builds a systems with numerous technical inputs and rules—hopefully not too many—it is time to optimize. This involves pinpointing the week points of a system and seeing if by adjusting some of your rules, tweaking some of your inputs, you can maintain the majority of your successful entries and eliminate some of your unsuccessful entries.
For example, if you adjust the periods for your slow and fast moving averages—or perhaps switch to an EMA—and determine your performance would improve, you can adjust your system accordingly. Or if more of your unsuccessful trades occurred on a Friday when major reports came out, you can eliminate entries on Friday’s with major reports.
The technician may notice that when the slow moving average crosses above the fast moving average signaling a long entry when both are already above the market price or crosses below when both are below the market price signaling a short trade, they bulk of the move has been made and those signals are less profitable, he or she may add a rule not to take a trade when this occurs. It is a time intensive—and data intensive— process. It is vital that that the technician has a great deal of positive examples of to justify a change in strategy or an additional rule. Eckhardt
Optimization is the practice of using past data to improve your system. The problem is that you are improving your system in a way that works perfect on past data but may have very little predictive value. There are some very complex ways to avoid this involving walk-forward analysis but the simplest —and cheapest— way to avoid this is to separate your data set into two elements: One dataset is used to optimize your system and the second dataset is used to test the optimized strategy.
When you run your newly optimized system on fresh data, it should perform as well or nearly as well as it did under the optimized results. If it performs significantly worse, it is a sign of over fitting. Basically you created a great system to trade in the past, which is only valuable if you also happened to build a time machine; which is way more complex than building a system.
By Daniel P. Collins