Home › Market News › Stocks, Inflation, and High Yield Bond Spreads
The Economic Calendar:
MONDAY: 3-Month Bill Auction, 6-Month Bill Auction, 3-Yr Note Auction
TUESDAY: NFIB Small Business Optimism Index, 10-Yr Note Auction
WEDNESDAY: MBA Mortgage Applications, CPI, Atlanta Fed Business Inflation Expectations, EIA Petroleum Status Report, 4-Month Bill Auction, 30-Yr Bond Auction, Treasury Statement
THURSDAY: Jobless Claims, PPI, Retail Sales, Business Inventories, EIA Natural Gas Report, 4-Week Bill Auction, 8-Week Bill Auction, Fed Balance Sheet
FRIDAY: Empire State Manufacturing Index, Import and Export Prices, Industrial Production, Consumer Sentiment, Baker Hughes Rig Count
Key Events:
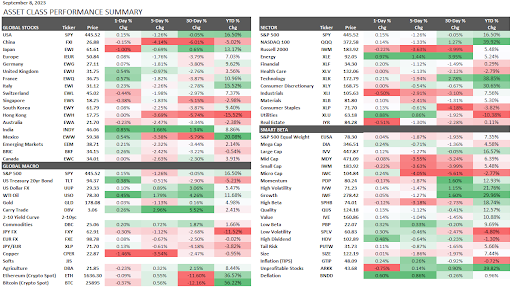
The S&P 500 ticked down -1.26% and Nasdaq 100 -1.33% on the shortened Labor Day holiday trading week.
The S&P 500 and Nasdaq indexes fell for the week due to concerns that a strong economy will force the Federal Reserve to keep interest rates high for an extended period.
Most companies have already released their earnings reports for the spring quarter.
Overall, the stock market is being weighed down by concerns about inflation and the prospect of higher interest rates. These concerns will likely continue to be a significant driver of market volatility in the near term.
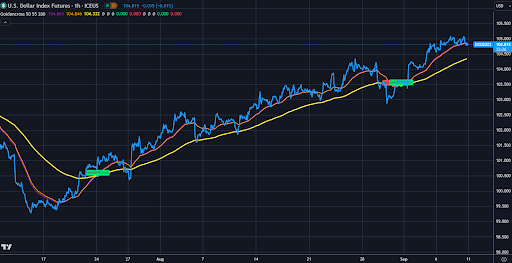
The U.S. dollar remains strong against most other currencies, as strong economic data suggests that the Federal Reserve will not be easing its monetary policy anytime soon.
The strong dollar is putting pressure on other currencies, particularly the Japanese yen and the Chinese yuan. The Japanese government has hinted that it may intervene in the currency markets to weaken the yen, but its efforts have been unsuccessful so far.
The Chinese central bank has also allowed the yuan to appreciate against the dollar, but this has done little to slow the pace of the dollar’s rise.
Source: TradingView
No jawboning this week. Federal Reserve officials are in a no-speech and media blackout before the September 19-20 FOMC meeting.
Some analysts think the Fed should support markets and may move to an easier monetary stance in 2024. However, the economic conditions may need to worsen before the Federal Reserve shows more apparent signs that the pivot is near.
We believe it’s reasonable to assume that the economy will “muddle through” in the coming quarters. It may slow, but not enough to enable the Fed to engage in significant interest rate cuts.
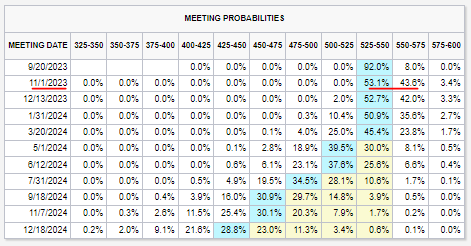
The CME FedWatch tool indicates a 92% probability of zero change in interest rates at next week’s Fed meeting. The fed funds contract implies a probability of 43% for an interest rate hike of either 25 basis points at the November meeting.
Source: CME Group
Headline inflation is expected to rise 0.5% month over month (MoM) in August, picking up in pace versus the 0.2% MoM print in July. The core rate is seen up 0.2% MoM, matching the prior month. Higher energy prices will likely drive the headline number higher, but the core rate is steady.
Moody’s analyst wrote, “While inflation will continue to moderate, the path to 2% price growth will be slow and rocky”.
The recent “spike” in bankruptcies in August has been discussed in the press in the last few weeks. Some traders worry it means a “credit event” is coming…
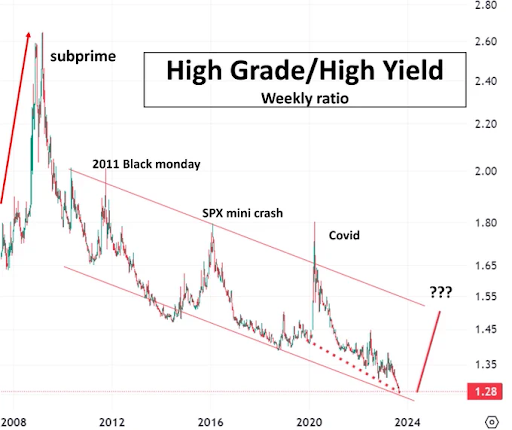
The data does not support this narrative. The high-grade/high-yield bond spread trades at the tightest levels in many years, signaling that bond traders are not expecting a credit event.
Sometimes, it takes the liquidity event for the dominoes to fall. Many things are now mismarked, but it is a moot point until someone is forced to sell.
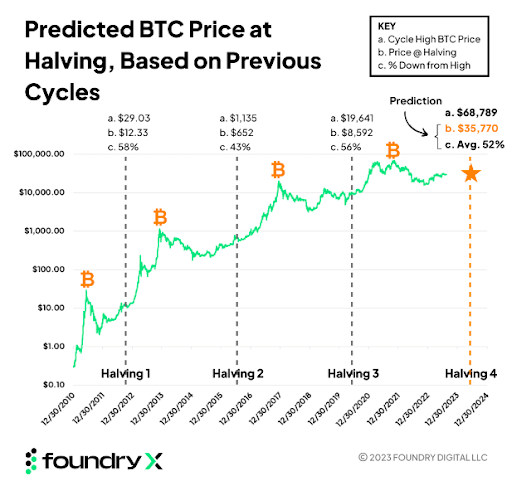
Predicting future Bitcoin prices is next to impossible. The halving is only eight months away, and Bitcoin mining specialist Foundry shares its knowledge of historical halving trends below.
We were interested to see what the BTC price could look like if history repeats itself.
The chart below shows the price of Bitcoin at cycle peaks and the percentage decline at halving. On average, Bitcoin price at halving is 52% down from the cycle high. This suggests a price of approximately $35,000 at next year’s halving (52% down from the peak of $68k).
This performance chart tracks the daily, weekly, monthly, and yearly changes of various asset classes, including some of the most popular and liquid markets available to traders.
