Home › Market News › Stock Futures, Interest Rates, and the Future of Inflation
The Economic Calendar:
MONDAY: 3-Month Bill Auction, 6-Month Bill Auction
TUESDAY: Retail Sales, Empire State Manufacturing Index, Import and Export Prices, Business Inventories, Housing Market Index, Treasury International Capital
WEDNESDAY: MBA Mortgage Applications, Housing Starts and Permits, Industrial Production, Atlanta Fed Business Inflation Expectations, EIA Petroleum Status Report, 4-Month Bill Auction, FOMC Minutes
THURSDAY: Jobless Claims, Philadelphia Fed Manufacturing Index, E-Commerce Retail Sales, Leading Indicators, EIA Natural Gas Report, 4-Week Bill Auction, 8-Week Bill Auction, Fed Balance Sheet
FRIDAY: Quarterly Services Survey, Baker Hughes Rig Count
Key Events:
The downside trade is getting interesting. Stock and index option market makers have flipped into short option gamma positions.
In addition, global CTA equity position exposure is at recent highs. CTAs risk having stop-loss trades triggered in massive size in a big down scenario.
These forces could create considerable overshoots to the up or downside intraday.
The market open and close have been seeing higher than normal institutional selling pressure. The positive gamma stabilizer is gone for now, and lower moves could accelerate to the downside fast if we move lower from here, as dealers will need to sell low and buy high.
Between short gamma and CTAs, the downside is the massive risk scenario: -$267 billion selling globally and -$79 billion selling in the S&P.
Short-term CTA momentum turns negative around S&P 500 4457, but 4278 is the big medium-term CTA level to watch. 4473 is the 50-day moving average, and 4186 is the 200-day moving average.
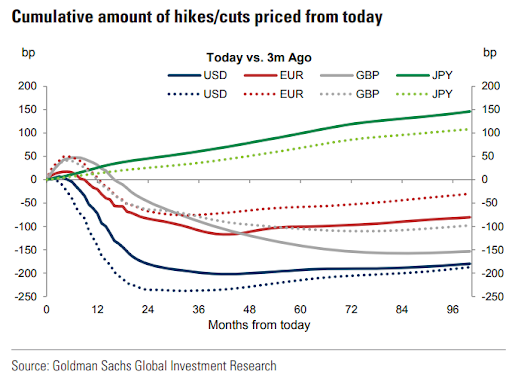
U.S. Treasury futures prices have been struggling and unable to keep a bid recently, despite a “cooling” inflation consensus and Fed speakers discussing 2024 rate cuts.
The terminal rate is between 5.25-5.50%, and the Fed’s June projections expect rate cuts to start in Q1 2024.
Our traders are positioning for the near term that yields should stay higher for longer. The foundations of the recent selloff in 10 and 30-year Treasury futures (price) are shaky, and near-term data flow may revert this recent price action.
With the Fed in a data-dependent mode, the FOMC meeting minutes release from the July meeting are not expected to contain too many surprises.
Traders will look for any “tells” on how the Fed assesses growth dynamics, given that inflation is slowly inching back towards the 2% target.
Apple (AAPL) — The largest stock in the world with a market cap just below $3 trillion has run into some technical trouble since reporting earnings ten days ago. After trading in a picture-perfect uptrend since March, you can see the clear break of the 50-day moving average, and the stock declined -4.17% last week (chart below).

Source: TradingView
FWIW – Barry Bannister, Market Strategist at Stifel, who called the rally of 2023, now says that the first half S&P 500 relief rally is over…and the second half will be flat.
American consumers are faced with another round of surging gasoline prices. We need to monitor this and how the inflation numbers react.
RBOB futures surged to a new year high of $2.97 and are up 19.03% YTD. Triple AAA reports average gasoline prices at the pump are also at a year high of $3.828.

Source: TradingView
Next week’s CPI reports in the UK, Euro Area, Canada, Japan, and Sweden will provide a few more pieces for the ‘end of cycle’ inflation puzzle.
With policy rates more obviously in restrictive territory, the timing and depth of rate cuts will increasingly come into focus.
More immediately, there is the question of a soft or hard landing. This week’s US CPI data hint at the former.
What makes trading challenging:
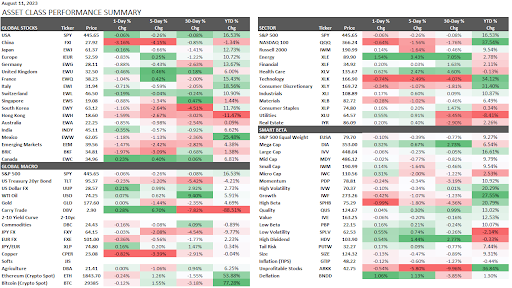
This performance chart tracks the daily, weekly, monthly, and yearly changes of various asset classes, including some of the most popular and liquid markets available to traders.