
The Relative Strength Index (RSI) is an extremely popular trading tool that attempts to define overbought and oversold conditions in an underlying market. It was created by J. Welles Wilder and introduced in Commodities Magazine in 1978.
RSI is a momentum oscillator that measures the speed and magnitude of recent changes in an underlying security or futures contract. The oscillator varies from 0-100 based on a calculation of average price gains vs. average price losses calculated over 14 periods.
Here is the actual RSI equation:
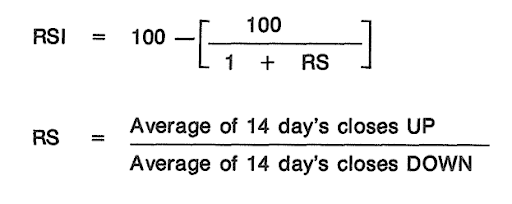
While it is important to understand the underlying math to know what you are viewing, RSI is now a standard part of nearly all charting packages, so traders can simply pull it up on an existing chart with a click of a button. They can even alter its metrics—changing the number of previous trading periods to calculate it and setting their own levels for overbought and oversold; though we would not encourage that.
What RSI tells traders
Wilder described five things that the RSI tells traders in his book, “New Concepts in Technical Trading Systems.” They are: Tops and bottoms, chart formations, failure swings, support and resistance, and divergence.
When the RSI oscillator ranges above 70, it indicates overbought conditions, and when it drops below 30, it indicates oversold conditions. Simply put, these levels can indicate a top or a bottom in the market. Short of that, they can also indicate corresponding support and resistance levels in the underlying market or the oscillator.
Below is a daily crude oil chart. Notice how often the market reverses after the RSI hits overbought (green line) or oversold (red line) territory.
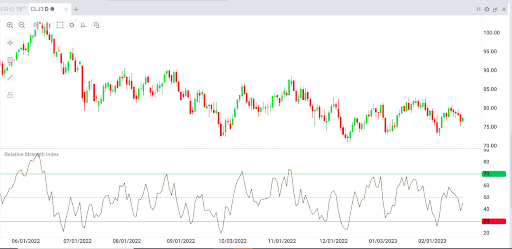
Looking closer at the June 2022 period shows that the RSI formed a well-defined bearish head and shoulders pattern prior to the sharp sell-off.
You can also see from the June 2022 rally that markets can remain overbought for quite some time.
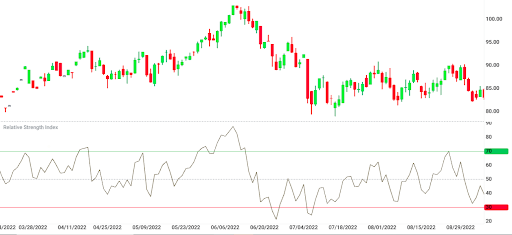
Perhaps the strongest signal the RSI produces is of market reversals when there is a divergence between the indicator and the underlying price chart. “Divergence occurs when the RSI is increasing, and the price movement is either flat or decreasing, [or] when the RSI is decreasing, and price movement is either flat or increasing,” Wilder wrote.
If you look closely at the second crude oil chart above, you can see that the RSI turned sharply lower while crude traded relatively flat at the top of the move. This divergence indicated a sharp sell-off was imminent.
Combining indicators
It is important to remember that the RSI is simply a measure that—based on research—indicates that a specific market’s momentum could be waning. It is not a panacea but a tool that has proven valuable when used properly. Markets can remain overbought or oversold for some time, so RSI is best used in conjunction with other indicators or strategies to confirm a market outlook.
J.B. Maverick suggests in an Investopedia post that using the RSI in conjunction with the Moving Average Convergence Divergence (MACD) indicator can produce strong reversal signals. MACD is a trend-following momentum indicator that shows the relationship between two moving averages. “MACD shows divergence by beginning to turn down as the price continues to advance,” Maverick writes. “The MACD can confirm that it is time to buy or sell when RSI indicates a security is oversold or overbought.”
One of the simplest strategies to trade is the moving average crossover. When the shorter-term moving average crosses above the longer-term moving average, it is a sign of upward momentum; when it crosses below the longer-term moving average, it is a sign of downward momentum. While such a strategy can be successful, it rarely works consistently on its own. But when you use other indicators to confirm this signal—such as a bearish cross while RSI is overbought—it can strengthen the signal and form a more consistent strategy.
While some analysts have had some success in manipulating the RSI—using different time periods and defining overbought/oversold at different levels than the standard 30-70, it is best to stay with the original metrics absent compelling research.
Avoid paralysis by analysis
As with all things trading-related, traders can get in their own way. While a valuable tool, RSI is not the Holy Grail and is best used in conjunction with other measures.
“The RSI, used in conjunction with a bar chart, can produce a new dimension of interpretation for the chart reader,” Wilder wrote, adding, “no single tool, method or system is going to produce the right answers 100% of the time. A successful trader utilizes several different kinds of input.”
But while it is important to use the RSI with other indicators, it is just as important to remember not to try and use it with every other indicator. When technicians try this, they fall into the trap of paralysis by analysis. Instead, traders should look at one factor to indicate a trade, with one or two additional studies used as confirmation.
Wilder made this point when introducing the RSI to traders. “Often, the problem is in narrowing this input down to two or three things that work best.”
By Daniel P. Collins