Home › Market News › RISKS TO HIGHER CRUDE OIL PRICES

The Economic Calendar:
MONDAY: Chicago Fed National Activity Index, Dallas Fed Manufacturing Survey, 3-Month Bill Auction, 6-Month Bill Auction
TUESDAY: Case-Shiller Home Price Index, FHFA House Price Index, Consumer Confidence, New Home Sales, Richmond Fed Manufacturing Index, 2-Yr Note Auction, Money Supply
WEDNESDAY: MBA Mortgage Applications, Durable Goods Orders, State Street Investor Confidence Index, EIA Petroleum Status Report, Survey of Business Uncertainty, 4-Month Bill Auction, 2-Yr FRN Note Auction, 5-Yr Note Auction
THURSDAY: GDP, Jobless Claims, Corporate Profits, Austan Goolsbee Speaks, Pending Home Sales Index, EIA Natural Gas Report, Kansas City Fed Manufacturing Index, 4-Week Bill Auction, 8-Week Bill Auction, 7-Yr Note Auction, Fed Balance Sheet, Thomas Barkin Speaks
FRIDAY: International Trade in Goods, Personal Income and Outlays, Retail Inventories, Wholesale Inventories, Chicago PMI, Consumer Sentiment, John Williams Speaks, Baker Hughes Rig Count, Farm Prices
Key Events:
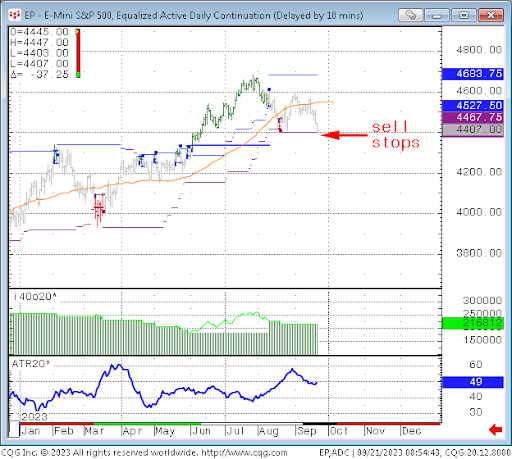
It is worth noting that intermediate-term CTAs trading the S&P 500 triggered sell-stops to initiate new short positions last week.
September and October are seasonally more volatile periods in stock markets.
The higher bond yields also come at a time when there was some concern around extended valuations, particularly in the large-cap technology space and among the “Magnificent 7” (Magnificent 7 stocks include AAPL, AMZN, GOOGL, META, MSFT, NVDA, TSLA).
Valuations now seem more stretched, and they face the challenge of a higher-rate environment.
In addition, markets have walls of worry to climb around a potential government shutdown and ongoing UAW strikes, which may also create near-term uncertainty.
Source: www.40in20out.com
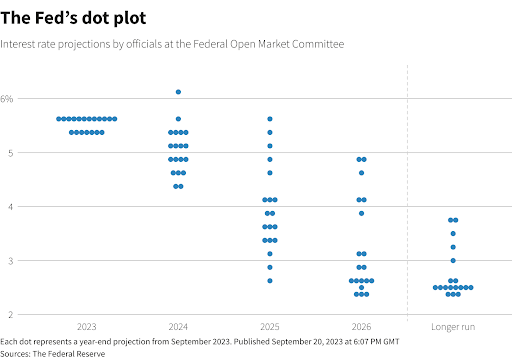
At last week’s meeting, the FOMC decided to keep the Federal Funds Rate target unchanged at 5.25-5.50%.
We have been forecasting “higher interest rates for longer” for many weeks. Last week, we saw many Secured Overnight Financing Rates (SOFR) and Fed Fund futures spreads reflect that view. The longer-term 10 and 30-year treasuries also saw an uptick in yields.
The big news was the change in the 2024 and 2025 dot plots – 2023 dot 5.6% (prev. 5.6%), 2024 5.1% (prev. 4.6%), 2025 3.9% (prev. 3.4%), 2026 2.9%, longer run 2.5% (prev. 2.5%)
The main takeaways are economic activity is expanding at a ‘solid’ pace (previously moderate), job gains have ‘slowed’ (prev. ‘been robust’) but ‘remain strong’, and inflation remains elevated. The central bank remains ‘highly attentive’ to inflation risks.
Fed officials still don’t see inflation back to their 2.0% target until 2026. As the economy dodges recession and unemployment stays low, Chair Jerome Powell said the Fed needs ‘convincing evidence’ its policy stance is bringing inflation back to target.
Source: Reuters
Oil analysts forecast $100 a barrel in the near term, as supply tightening by OPEC+ and recovering demand in the US and China outweigh inflation and monetary tightening concerns.
Goldman Sachs has raised their Brent oil forecast to $100, citing the following factors:
While many analysts call for oil prices to reach $100 a barrel, we do not believe this would be “demand destructive.” We base this assessment on the following:
However, there is a risk that higher oil prices could lead to a recession, which would, in turn, weigh on oil demand. We see energy as a preferred sector relative to the broader equities market, should our house view on recession materialize.
In the past, energy indices outperformed the broader equity index during recession years, except when equities and oil have sold off sharply.
The government is likely headed for a shutdown on Oct. 1 unless Congress can pass a new “Continuing Resolution.”
At this point, that’s unlikely to happen, first because the Republicans in the House haven’t even agreed on a spending plan they can pass internally, and even when they do, that plan likely has no chance of passing the Senate.
Instead, that plan will mark the start of negotiations or compromise that ultimately will pass. But that’s unlikely to occur before the Oct. 1 deadline.
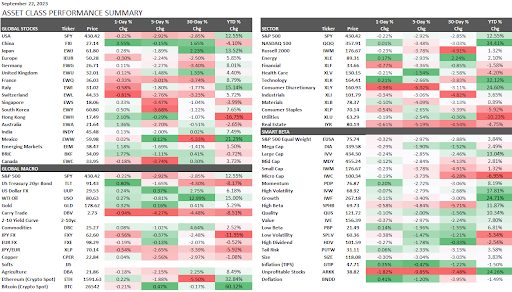
This performance chart tracks the daily, weekly, monthly, and yearly changes of various asset classes, including some of the most popular and liquid markets available to traders.