Home › Market News › OPEC+, Talking Feds & More Key Events for the Week

The Economic Calendar:
MONDAY: New Home Sales (9:00a CST)
TUESDAY: Case-Shiller Home Price Index (8:00a CST), Consumer Confidence (9:00a CST), Christopher Waller Speaks (9:00a CST), Austan Goolsbee Speaks (9:00a CST), Michelle Bowman Speaks (9:45a CST), Michael Barr Speaks Twice (1:05p CST & 2:30p CST)
WEDNESDAY: GDP (7:30a CST), Trade Balance In Goods (7:30a CST), Loretta Mester Speaks (12:45p CST), Beige Book (1:00p CST)
THURSDAY: Jobless Claims (7:30a CST), Personal Consumption Expenditures (7:30a CST), John Williams Speaks (8:05a CST), Chicago PMI (8:45a CST), Pending Home Sales (9:00a CST)
FRIDAY: ISM Manufacturing (9:00a CST), Construction Spending (9:00a CST), Austan Goolsbee Speaks (9:00a CST), Jerome Powell Speaks (10:00a CST), Jerome Powell & Lisa Cook Speak (1:00p CST)
Key Events:
For the week, the S&P 500 advanced by +1.19%, and the Nasdaq-100 was higher by +1.15%. The Russell 2000 lagged on the week and was down -0.36%.
The leading sectors for the week were Health Care, Financials, and Technology, while Energy and Consumer Staples were the laggards.
Analysts at Goldman Sachs expect the S&P 500 to rise to 4,700 by the end of 2024.
Goldman says, “Resilient economic growth at the beginning of the year will force the market to push back its current pricing that Fed cuts will begin in Q2”.
Goldman adds, “Later in the year, the first Fed cut and resolution of election uncertainty will lift U.S. equity prices.”
Here is a look at some of the trading flow indicators for interest rate futures.
CFTC positioning data for the week ending November 14 shows that asset managers’ net long positions (as a percent of open interest) in U.S. Treasury futures and options generally fell.
Positioning in the U.S. Treasury bond contract (30-year) fell, bringing positioning down to the 71st percentile. The contract has been the center of attention amid a possible cheapest-to-deliver (CTD) switch.
Leveraged funds’ net shorts generally fell, but positioning across most of the curve is near the shortest of the past five years.
Bond ETF and mutual funds had about $1 billion in outflows, representing the 2nd percentile over the past six months.
OPEC+ countries were initially set to meet on November 26th to set production guidelines but have now rescheduled that meeting for November 30th.
The whisper is that Saudi Arabia and Russia could extend or deepen their voluntary production cuts.
Crude oil futures have steadied over the last week but are down more than 10% over the previous six weeks.
Here are three potential scenarios:
1) Extension of Current Cuts.
2) Deeper Cuts.
3) No Change, wait-and-see approach.

Natural gas futures settled lower for a third straight week on concerns over high supply levels amid mild weather and subdued demand.
The January (F) futures contract settled last week at $2.999/MMBtu.
Analysts expected cold temperatures over the weekend but revised the longer-range forecast to warmer.
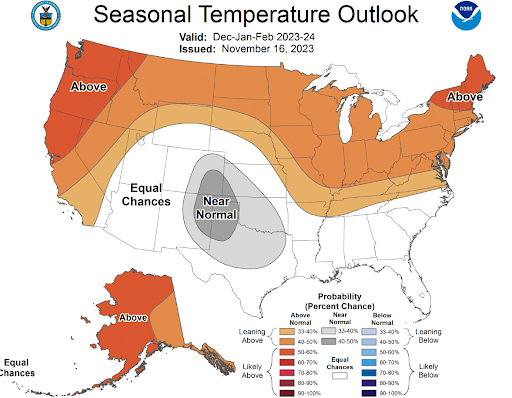
The U.S. government is forecasting a warmer-than-average winter across the entire northern tier of states, which will cut natural gas demand and consumption.

The U.S. Justice Department announced a settlement with cryptocurrency exchange Binance and faces a record $4.3 billion payout to resolve criminal charges.
Following a multiyear investigation, U.S. authorities said Binance allowed bad actors on the platform, enabling transactions linked to child sex abuse, narcotics, and terrorist financing.
JP Morgan analysts believe Binance’s settlement with regulators is favorable for the crypto industry.
In a research note, the analysts wrote that a settlement could eliminate the systemic risk of hypothetically collapsing the exchange. The report added that uncertainty around the exchange would subside and benefit trading volumes on the platform and its protocol, BNB Smart Chain.
The best insider trading signal around. Forbes does it again, this time to Binance founder CZ.
Forbes has faced relentless mockery – pointing out the dubious record of business figures fined or jailed who have earned a spot on one of its magazine covers.

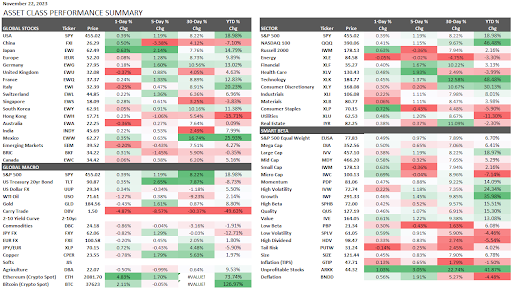
These performance charts track the daily, weekly, monthly, and yearly changes of various asset classes, including some of the most popular and liquid markets available to traders.

