Home › Market News › Nasdaq Seasonality, Interest Rates, and Grain Futures
The Economic Calendar:
MONDAY: PMI Manufacturing Final, ISM Manufacturing Index, Construction Spending, 3-Month Bill Auction, 6-Month Bill Auction, NYSE Early Close 1:00 EDT
TUESDAY: Independence Day Holiday: U.S. Markets Closed
WEDNESDAY: OPEC Meeting, Motor Vehicle Sales, MBA Mortgage Applications, Factory Orders, 4-Month Bill Auction, FOMC Minutes, John Williams Speaks
THURSDAY: OPEC Meeting, Challenger Job-Cut Report, ADP Employment Report, International Trade in Goods and Services, Jobless Claims, Lorie Logan Speaks, PMI Composite Final, ISM Services Index, JOLTS, EIA Petroleum Status Report, 4-Week Bill Auction, 8-Week Bill Auction, Fed Balance Sheet
FRIDAY: Employment Situation, EIA Natural Gas Report, Baker Hughes Rig Count
Key Events:
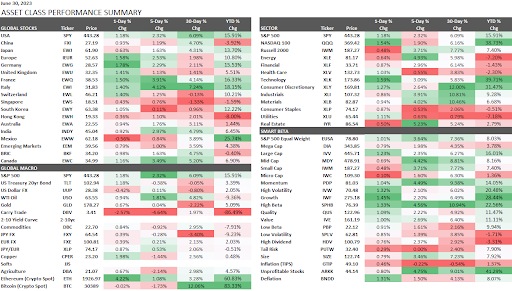
Stocks traded higher by +6.09% on the S&P 500 and the Nasdaq 100 by +6.16%. The strongest stock sectors were Consumer Discretionary +12%, Industrial +10.8%, and Materials +10.46%. The lagging sectors were Utilities +0.79% and Consumer Staples +2.06%.
U.S. 2-year Treasury Notes jumped to a fresh post-March high of 4.90%, while the 10-year bond reached 3.84%.
WTI crude oil edged over $70 a barrel and was higher by +4.8% for June, gold retreated to $1,916 per ounce -2.2%, and the VIX stayed below 14.
In summary, while many anticipated events unfolded as predicted, the exceptional resilience and substantial gains witnessed in the broader stock market during the first half of the year caught industry analysts off guard, predominantly due to the impressive performance of a handful of large-cap stocks.
The S&P 500 recorded a year-to-date increase of over 15% as of June 30th, with the Nasdaq composite exhibiting an even more remarkable surge of over 38%.
The developments observed during the first half of the year primarily aligned with our initial expectations. Inflationary pressures exhibited signs of easing, and the pace of U.S. economic growth decelerated. The Federal Reserve is approaching the conclusion of its rate-hike cycle, instilling a sense of stability in the monetary policy landscape. Notably, the standoff surrounding the U.S. government debt ceiling was successfully resolved.
Interesting note on stock market seasonality – The Nasdaq 100 has posted positive returns in July for the past 15 consecutive years, with an average return of +4.64%.
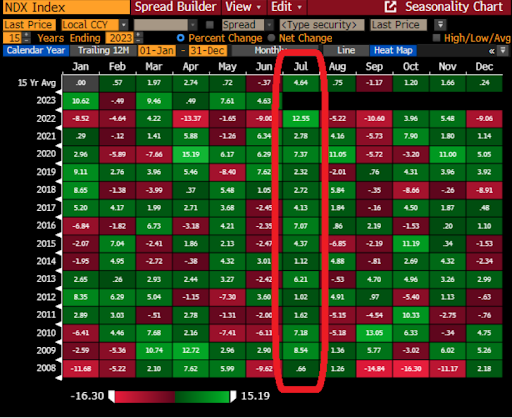
Source Bloomberg and GS Research
The release of the FOMC minutes this Wednesday should not surprise traders.
The FOMC Minutes in June surprised traders by raising its rate projections for 2023 and beyond. The forecasted rates for 2023 were increased by 50 basis points, indicating two further 25 basis points rate rises ahead.
The hawkish forecasts were driven by an improved view of GDP growth, higher inflation expectations, and a lower projected unemployment rate.
Fed Chair Powell acknowledged the progress made but emphasized that the impact of tightening policy was yet to be fully realized. While most policymakers anticipate further rate hikes, they expect subdued growth to persist.
U.S. Treasury yields compared to last week:
30-Year yield 3.86%
10-Year yield 3.84%
5-Year yield 4.15%
2-Year yield 4.90%
2-10 Yield spread -1.05%
Multiple rainstorm systems traveled across the corn belt heart over the weekend. Traders will watch how the market reacts after reducing the drought risk premium.
The big surprise in last Friday’s USDA report was corn and soybeans both saw a significant shift in plantings from March intentions, with both crops seeing a significant change in potential ending stocks.
Corn planted acreage was higher than traders expected, 2.1 million acres higher than March intentions of 94.1 million acres, resulting in one of the highest amounts of corn planted in the United States on record.
The drop in planted soybean acreage from March intentions was the second largest in the last 33 years, trailing only 2019. The 4.2 million acre drop in soybean plantings would result in a 218.4 million bushel reduction in production potential.
Bitcoin stays above $30,000 despite more news on ETF regulatory approval. According to The Wall Street Journal, the Securities and Exchange Commission (SEC) has expressed concerns about the recent wave of applications submitted by asset managers to launch spot bitcoin exchange-traded funds (ETFs).
Sources familiar with the matter state that the SEC deemed these filings inadequate regarding clarity and comprehensiveness. The regulatory agency reportedly conveyed its concerns to prominent firms such as BlackRock, Fidelity, and several other asset managers.
If approved, an ETF that tracks the actual spot price of Bitcoin would represent a significant milestone for the industry as it would facilitate broader access to the cryptocurrency. Investors could conveniently buy and sell bitcoin through their brokerage accounts, similar to trading shares of stock.
This performance chart tracks the daily, weekly, monthly, and yearly changes of various asset classes, including some of the most popular and liquid markets available to traders.