Home › Market News › Meme Stock Mania, Bitcoin Inflows, and Thoughts On The May Jobs Report

The Economic Calendar:
MONDAY: 3-Year Note Auction (12:00p CT)
TUESDAY: NFIB Business Optimism Index (5:00a CT), Redbook (7:55a CT), 10-Year Note Auction (12:00p CT)
WEDNESDAY: MBA Morgage Applications (6:00a CST), CPI (7:30a CT), Inflation Rate (7:30a CT), Consumer Inflation Expectations (10:00a CT), WASDE Report (11:00a CT), Fed Interest Rate Decision (1:00p CT), Fed Press Conference (1:30p CT)
THURSDAY: Jobless Claims (7:30a CT), PPI (7:30a CT), EIA Natural Gas Report (9:30a CT), John Williams Speaks (11:00a CT), 30-Year Bond Auction (12:00p CT)
FRIDAY: Import/Export Prices (7:30a CT), University of Michigan Consumer Sentiment (9:00a CT), Baker Hughes Rig Count (12:00p CT), Austan Goolsbee Speaks (1:00p CT)
Key Events:
Economists predict a slightly lower-than-expected rise in CPI headline inflation for May, with a 0.2% M/M increase. Core inflation is forecast to hold steady at 0.3% M/M.
This data arrives just before the Federal Reserve’s June policy meeting, which is likely too late to influence their decision.

Source: Tradingeconomics
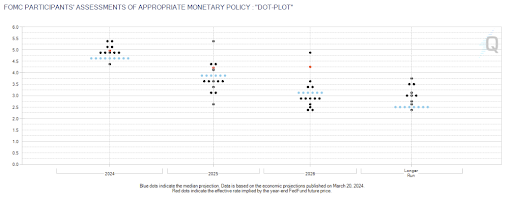
The Federal Open Market Committee (FOMC) is expected to keep rates unchanged at 5.25-5.50% in June.
Instead, the Fed’s focus will be on its updated economic projections, specifically, how many rate cuts they will pencil in this year.
The March forecasts narrowly projected three rate cuts this year, but analysts say that there are risks the updated projections could reduce that view to just two reductions or even fewer.
Source: CME Fedwatch
A hotter-than-expected Friday jobs report throws a curveball at the Fed. Can the Fed cut rates when job data is this robust? What data is more accurate (government data or private payroll data)?
Takeaways:

Source: Bloomberg
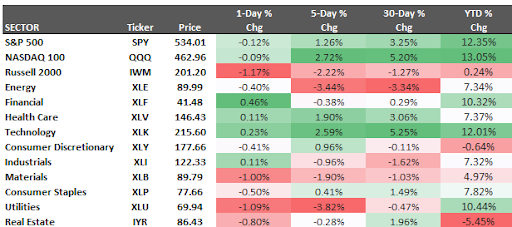
The S&P 500 and Nasdaq 100 stock indexes finished higher for the week, +1.26% and +2.72%, after U.S. non-farm payrolls rose much more than expected in May, however dimming hopes for interest rate cuts any time soon. Employers added 272,000 new jobs, while average hourly earnings over the past 12 months ticked higher after three straight monthly declines.
One index outlier this year is the Russell 2000, which was lower -2.22% for the week and is only +0.24% higher on the year.
All sectors performed well except Energy (-3.44%), Utilities (-3.82%), and Materials (-1.9%), which showed weakness.
While the broader stock market enjoyed a healthy week, a separate story unfolded in the realm of meme stocks. The saga of Gamestop (GME) and retail investor favorite Keith Gill, aka Roaring Kitty, took another wild turn.
Roaring Kitty’s announcement of a YouTube live event on Thursday afternoon sparked a frenzy, doubling GME’s share price from $26 to a high of $66 in after-hours trading. This appeared to be fueled by momentum chasers blindly following cryptic signals.
Precipitous Fall: The dream run turned sour pre-market as GME shares crashed to $37 on news of the company’s massive 75 million share offering. This dilution of ownership signaled a potential cash grab, raising questions about the company’s fundamentals.
To add to the chaos, many considered Roaring Kitty’s live event a bizarre letdown. Lacking any clear investment thesis, it further eroded confidence and sent the stock plummeting to $27 by the end of the day.
A Costly Gamble: While Roaring Kitty might have enjoyed a short-lived paper gain of nearly $1 billion, the bubble quickly burst. By the close of trading, those gains had shrunk to a mere $200 million. This is a stark reminder of the inherent volatility and risk of chasing meme stocks based solely on hype and speculation.
The U.S. has yet to signal a dovish stance in monetary policy like some of their G7 economic allies.
In a move marking a potential shift in global monetary policy, the Bank of Canada (BOC) became the first G7 central bank to cut rates last week, lowering its key rate by 25 basis points (bps) to 4.75%. This signals a potential for further cuts, though the fight against inflation remains a central concern.
Following suit, the European Central Bank (ECB) announced a similar 25 bps reduction in its deposit rate, bringing it down from a record high of 4.00% to 3.75%. This would mark the first such cut since September 2019.
While both central banks signal a dovish shift, the ECB’s guidance remains unclear. Unlike the BOC, which hinted at further easing, the ECB has not yet indicated whether this cut marks the beginning of a sustained easing cycle or a one-off adjustment.
Some European economists and analysts anticipate a follow-up cut to 3.50% as early as next month. The central bank’s decision will be closely scrutinized, with traders seeking further clues about its future monetary policy path.
Last week, the wheat and soybean futures markets witnessed sharp declines, with wheat taking the lead. This marked Chicago wheat’s eighth consecutive day of losses, while soybeans fell for the eighth time in nine days.
A confluence of factors drove the selloff:

It was another week of positive inflows in Bitcoin ETFs.
This is the number one thing traders are looking at to gauge where Bitcoin prices are going…
Read: Understanding the three phases of the Bitcoin ETFs market
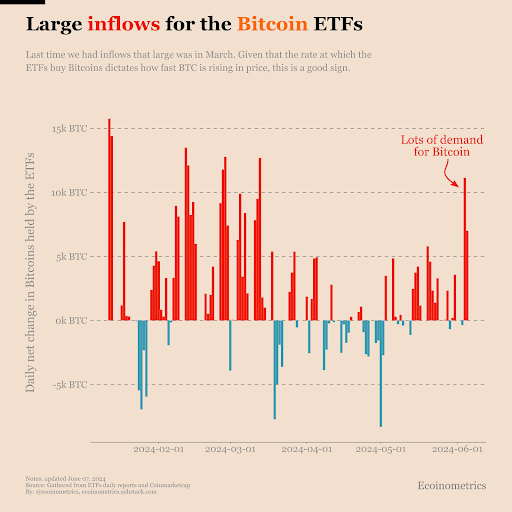
Source: Ecoinometrics
There is a concept in trading that goes something like this: if all the facts are lined up one way and the pricing still doesn’t move, you may be missing something. A corollary is that if you are too early, you are wrong.
These performance charts track the daily, weekly, monthly, and yearly changes of various asset classes, including some of the most popular and liquid markets available to traders.


