Home › Market News › July Jobs Recap, Interest Rates, and Crude Oil Futures
The Economic Calendar:
MONDAY: 3-Month Bill Auction, 6-Month Bill Auction, Investor Movement Index, Consumer Credit
TUESDAY: NFIB Small Business Optimism Index, International Trade in Goods and Services, Wholesale Inventories, 52-Week Bill Auction, 3-Yr Note Auction
WEDNESDAY: MBA Mortgage Applications, EIA Petroleum Status Report, 4-Month Bill Auction, 10-Yr Note Auction
THURSDAY: CPI, Jobless Claims, EIA Natural Gas Report, 4-Week Bill Auction, 8-Week Bill Auction, 30-Yr Bond Auction, Treasury Statement, Fed Balance Sheet
FRIDAY: PPI-Final Demand, Consumer Sentiment, Baker Hughes Rig Count
Key Events:
US Non-Farm Payrolls increased by 187,000 last month while wages rose more than expected.
Robust payrolls along with inflation running at the slowest pace in more than two years, the data supports growing calls that the FOMC can tame price pressures without inducing a recession or “Soft Landing.”
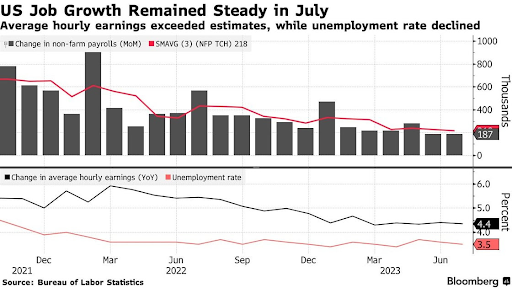
Source Graph: Bloomberg
An interesting narrative playing out in the 10 and 30-year market is hard to identify, but easy to see the trend with yields recently hitting fresh YTD highs.
On Friday, the trend reversed, weaker-than-expected payroll growth in July catapulted prices in Treasury futures higher, as the 10yr yield dipped 15 basis points to 4.04% from 4.19%, and the 2yr yield declined to 4.78% from 4.9%.
Things began escalating a week ago following the Bank of Japan’s policy tweak (yield curve control). Still, since then, Fitch downgraded U.S. debt, and the Treasury increased the size of longer-term debt sales to address growing borrowing needs.
Traders are watching the market auctions of 3,10, 30-year bonds and notes this week. Issuance is higher than initially forecasted. How will the market digest?
CURRENT U.S. TREASURY YIELDS:
30-Year yield 4.20% vs. 4.01%
10-Year yield 4.04% vs. 3.95%
5-Year yield 4.13% vs. 4.17%
2-Year yield 4.77% vs. 4.88%
2-10 Yield spread -0.73% vs. -0.92%
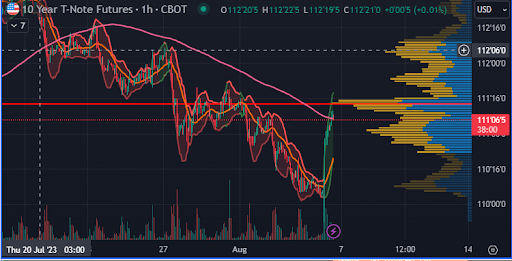
Source: TradingView
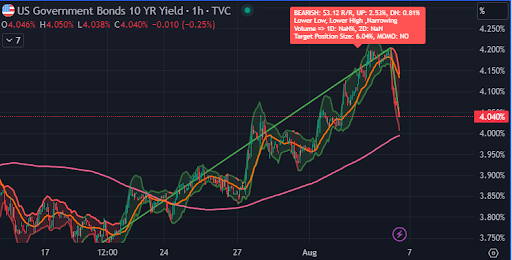
Source: TradingView
WTI crude pushed towards year-to-date highs near $83 per barrel as traders abandoned its growth pessimism
Hedge fund and CTA managers have grown increasingly optimistic about a recovery in oil prices. Over the past month, many have closed out bearish bets on crude oil futures.
Shrinking supply due to the OPEC+ and Saudi Arabia’s cuts and resilient demand despite recession fears – with oil consumption estimated to have already set record highs in July – have made fundamentals look increasingly bullish for the rest of the year.
Macroeconomic sentiment in the oil market has also improved, with Fed cues that the U.S. could manage to avoid a recession and expected stimulus in China, the world’s top crude oil importer, to prop up an unconvincing economic rebound after the end of the Covid restrictions.
Stocks took a tumble last week, as the S&P 500 dropped -2.21% and the Nasdaq 100 fell by -2.98%. The market cap leader Apple fell around 5% after presenting lackluster earnings.
The Energy stock sector was the leader last week, +1.25%, and Tech stocks were the worst performing -3.8%.
80% of S&P 500 firms have beaten Q2 consensus EPS estimates, but only 59% have exceeded revenue expectations. That current percentage of revenue beats is the lowest level in three years.
The VIX volatility index jumped above 17 for its most elevated finish since late May.
Coinbase is taking off the gloves and ready for a street fight.
CEO Brian Armstrong said the SEC asked the exchange to de-list all assets except BTC. In an interview with the Financial Times, Armstrong added the SEC’s recommendation came before it made enforcement actions against the exchange last month.
Armstrong also said the SEC informed the exchange it believes every cryptocurrency ‘other than bitcoin is a security.’
Those are fighting words, and the stock retraced last week by about -8%. However, the stock is still +139% for the year.
This performance chart tracks the daily, weekly, monthly, and yearly changes of various asset classes, including some of the most popular and liquid markets available to traders.