Home › Market News › Index Futures, Fresh Economic Data, A Crypto Update
The Economic Calendar:
MONDAY: Housing Market Index, 3-Month Bill Auction, 6-Month Bill Auction, Treasury International Capital
TUESDAY: FOMC Meeting Begins, Housing Starts and Permits, 20-Yr Bond Auction
WEDNESDAY: MBA Mortgage Applications, EIA Petroleum Status Report, 4-Month Bill Auction, FOMC Announcement, Fed Chair Press Conference
THURSDAY: Jobless Claims, Philadelphia Fed Manufacturing Index, Current Account, Existing Home Sales, Leading Indicators, EIA Natural Gas Report, 4-Week Bill Auction, 8-Week Bill Auction, 10-Yr TIPS Auction, Fed Balance Sheet
FRIDAY: PMI Composite Flash, Baker Hughes Rig Count
Key Events:
Large-cap and small-cap stocks have been trading in opposite directions lately, with the correlation between the two equity indices reaching a record low.
The rolling 100-day correlation between the daily percentage change of the Nasdaq and the Russell 2000 is currently at just 0.61, down from a historical average of over 0.9. This means that large-cap and small-cap stocks are moving less and less in sync.
There are several possible explanations for this divergence. One possibility is that investors are rotating into different market sectors, with large-cap stocks benefiting from strength in technology and healthcare.
In contrast, small-cap stocks are more exposed to cyclical industries like energy and materials.
Whatever the reason, the divergence between large-cap and small-cap stocks is a notable trend that investors should be aware of.
Higher-for-longer interest rates are the dominant theme in bond markets right now.
Analysts expect the Federal Open Market Committee (FOMC) to keep policy rates unchanged at its meeting on Wednesday. However, given the stronger-than-anticipated August inflation report, they expect the Fed to signal a more hawkish stance in its press conference.
The most tradable information from the meeting will be the update on the projected path of policy rates (dot plots). Analysts expect the 2023 dot plot to remain the same, with a higher probability of pushing back any rate cuts in 2024.
The Fed will likely keep rates unchanged for the rest of the year to retain optionality in November and December and to continue to push cut pricing further into 2024.
The spread between the 2023 and 2024 dot plots was 100 basis points in June.
Given the economy’s resilience revealed over the past quarter, analysts expect this spread to narrow to 75 basis points as the Fed transitions from hiking to holding rates.
WTI Crude Oil futures crossed above $90 and are creating headwinds for the economy (inflation) and the Fed.
The upward climb is due to various factors, notably recent production cuts by Saudi Arabia and Russia. However, the pace of the increase in supply cuts is becoming a bigger topic of discussion.
After remaining below $80 per barrel for most of 2023, WTI crude broke above that level in the summer and has soared over 17% over the past three weeks, helping to raise costs on everything from transportation to manufacturing.
Oil and gas companies are quick to point out the regulatory restrictions on their sector. At the same time, releases from the Strategic Petroleum Reserve have brought SPR supplies to their lowest level in 40 years. The Biden administration would likely consider additional releases if WTI crude tops $100 per barrel.
We are tracking growth in the U.S. through nowcasts and not the traditional backward-looking government GDP releases.
We believe growth is slowing, but the Atlanta Fed’s GDPNow starkly contrasts with the NY Fed’s new GDP tracker.
Source: NY FED https://www.newyorkfed.org/research/policy/nowcast#/nowcast
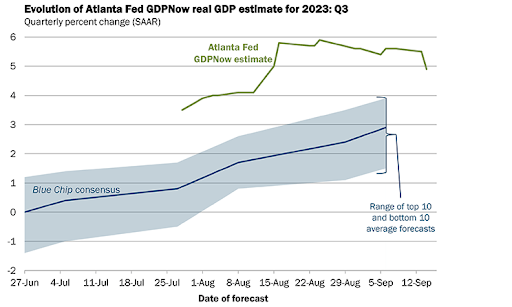
Source: Atlanta Fed https://www.atlantafed.org/cqer/research/gdpnow
Last week, the European Central Bank (ECB) surprised traders with a rate hike. However, it was a “dovish” hike, if there is such a thing.
The ECB raised its key interest rate to a record high of 4%, signaling that the hike, its 10th in a 14-month-long fight against inflation, was likely to be its last.
Over the past 30 days, Solana (SOL) has seen a 17% decline, underperforming other major cryptocurrencies such as BTC and ETH. This underperformance has coincided with several factors, including:
Despite the recent challenges, SOL remains a popular blockchain platform with many key technical advantages, such as high transaction throughput and scalability at low cost. GitHub developer activity associated with the Solana network has also remained consistent.
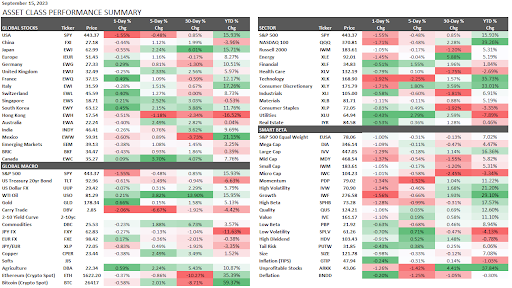
This performance chart tracks the daily, weekly, monthly, and yearly changes of various asset classes, including some of the most popular and liquid markets available to traders.