Home › Market News › How to Use Seasonality in Your Favor
As traders, we are continually working to make sure we have all the most useful tools available in our box. Furthermore, to be effective, some tools must be periodically sharpened; in other words, we must maintain our tools.
One often overlooked tool is seasonality. For some traders who primarily focus on day trading, seasonals might have a more modest effect on their gameplan. Additionally, the seasonal calendar receives push-back because it is an imperfect tool; however, there is no flawless indicator.
What’s important is how you use a tool. First, seasonal trends are not a trading methodology, meaning they cannot determine when to enter and exit a trade. However, when used beside your existing methods, the calendar can help identify bias and reward potentials on a trade.
Within any market, seasonal trends have varied reasons behind the historical pattern. Sometimes it is psychology, how the times of year affect how fund managers might be more or less aggressive in their holdings. Other times it deals with fundamentals, how a commodity is active in times of the year such as planting and harvest in agriculture or the crude oil market when there is more transportation in the warmer months and less so when the weather is cooler. These factors might also directly correlate to a commodity currency, a nation whose economy depends significantly on a primary export.
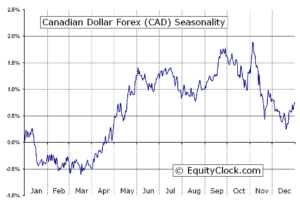
The Canadian dollar (CAD) shown above is an excellent example of a commodity currency as Canada’s economy and oil exports are closely tied. You will observe this 20-year track record of the CAD and how performance in the warmer weather months contrasts with cooler weather. Historically speaking, the CAD tops out in September and then rides lower into January, with rallies around Thanksgiving (US) and Christmas, when there is more demand on oil due to travel.
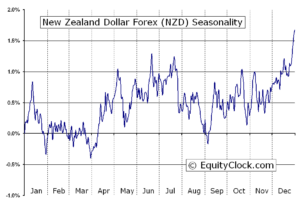
Meanwhile, the New Zealand dollar (NZD) pictured below is also a commodity currency, exporting dairy and meats. You’ll find that in September, the NZD often finds a low and rallies into the end of the year. This might be due to multiple factors; however, an exporter depends on oil to transport, and as export costs decrease during the colder months, the profit margins increase.
Does this mean that I am buying the NZD and shorting the CAD now in September? Not exactly, what this does mean is that I am alert to the possibility. There are some years when the seasonals are not consistent with history. So what good does this information do?
What’s important to remember is that while the tendency might be for a market to top or bottom in September, sometimes this can happen sooner or later. You will want to keep an eye on your momentum and trend indicators to fine-tune your entries.
Traders can find seasonal charts on any futures or currency market. If this is something that you find intriguing and useful, some subscription-based services help fine-tune the data. Let’s talk about this more in the comment section below.