Home › Market News › How To Recognize A Dead Cat Bounce
Eventually, in the life of a trader, he or she will encounter the term “dead cat bounce.” There are multiple ways that this pattern can formulate in a given time frame, but one example is when a market is declining. A sell-off may have a noticeable rally that lasts 1-3 days then returns to the selling pressure. The market did rally; however, it was short-lived. Let’s take a look at how these bounces come about and how you can recognize them.
There are multiple reasons why dead cat bounces happen. One simple reason is that no market goes straight up or down. A secondary reason and more practical one is that eventually, large position holders rebalance their holdings. Either by short-covering to take profit, or buying to even out a portfolio, a bounce may occur.
When you consider that many traders build strategies hoping to capitalize on exhausted markets- as in selling highs or buying lows- this sometimes gives a lot of fuel to these bounces and can they enjoy a boost of short-term momentum.
However, the challenge to traders is in determining if such a rally is sustainable. Any of us might prefer to jump into a market that has bottomed and is now on the rebound; however, the sudden reversals in volatile markets can be brutal for bottom fishers.
I use a simple method to identify a potential dead cat bounce, and it has a chance to work on any given time frame. However, first, I do wish to make a light disclosure. As with anything in trading, there is no perfect or flawless price analysis method. Like how a carpenter has many tools in their box for the nuances of their diverse work, we as traders also have multiple ways of viewing the market to get the job done.
Therefore, while this is an imperfect measure of a dead cat bounce, I have found more times than not, it keeps me on the right side of a trending market, with this week being a primary example of how it worked.
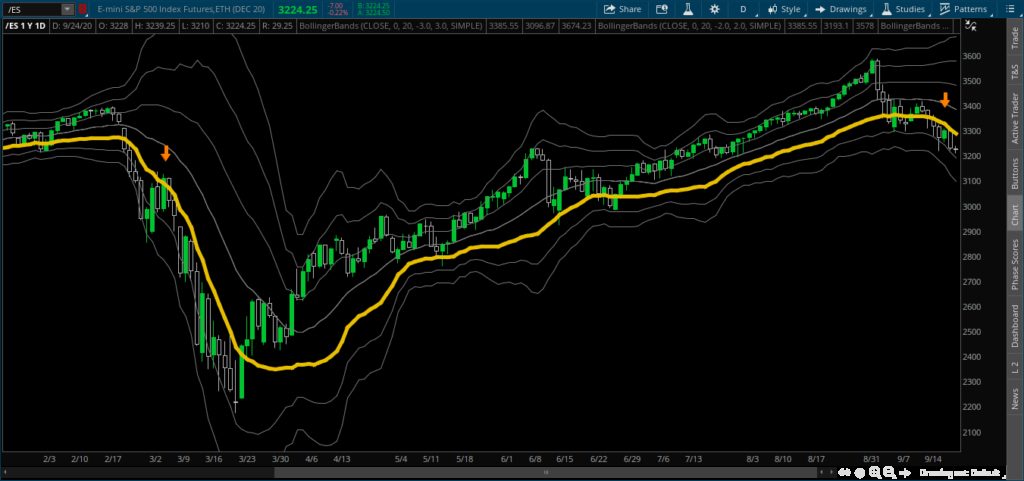
The method is simple: adding standard deviations to a price chart. The example below shows the Bollinger Bands, 20-period moving average with one, two, and three standard deviations. However, the -1 standard deviation is highlighted in yellow, and for a good reason.
The market is the S&P 500 futures, which is now experiencing some greater volatility. The time frame is a daily chart.

First, you will notice the left of the chart, when this market began to crash back in the spring of this year. During the pandemic-induced collapse, there were healthy rebound days, shown by the green candles. However, as long as this market stayed below the -1 standard deviation (yellow line), the trend was intact.
A channel was created during that sell-off between the -1 and -2 standard deviations, which signifies a very healthy trend. However, that’s the topic of another article.
Now, notice, once the S&P 500 futures bottomed, then traded over the yellow line, a historic rally then ensued. Furthermore, this -1 standard deviation has since been a significant risk marker, offering a support area for those who would buy the dip in May and June.
More recently, since the start of September, I anticipated volatility to re-enter this market. The momentum change this month has been nothing short of noticeable. However, this week, I began to assess if perhaps this market may be ready to bounce. So I placed the Bollinger Bands and found resistance, right at that yellow line (-1 standard deviation).
I cannot strongly assert what this market will do next; however, I indicated that Tuesday’s rally was nothing more than a dead cat bounce. You will see the bands are widening, or in other words, the mouth is opening, and I would expect this market to make a run at touching the lowest band. There is a fundamental reason behind this move, one that I identified in the article from last month, namely the election’s uncertainty.
I cannot understate this that this market is quick to reverse, and as soon as it looks its weakest, it often switches direction and hurts shorts. This is why I only buy smaller sizes unless the market is above the middle line on the chart.
So be in tune, keep your risk-to-reward healthy, and watch out for the dead cat bounce!