Home › Market News › How Monthly Timing Influences Market Trends
My writings often identify a trade, such as carpentry, as an illustration for trading. The carpenter will utilize several different nail sizes, depending on whether he is installing trim or framing a house. Furthermore, different carpentry types require various tools, it may be a larger or smaller hammer, or a table saw for one project, and a circular saw for the next. The point is that the carpenter needs many tools to be accessible, even though some tools are only used sporadically.
The same is true when trading; there are various tools we keep stored in our toolbox. Many of these tools are not mutually exclusive but work together to complement each other. You may be a trader who specializes in a single aspect of trading, something like the carpenter that does trim work only, or you might be a jack of all trades who does everything from scalping to swing trading.
Today, I will introduce an additional way of gauging a market. What I will show is not a strategy or system, it is an indicator, and like any method, it has flaws and imperfections, that means you don’t blindly try to implement this, but rather see if this may assist your current work.
When I was in the institutional world, I learned to look at the cycles within the month. In the same way that each day has an open followed by midsession and then a close, so also a month can be divided into three cycles. What I do is count the number of business days for the month, if you are working with a currency market like the USD/JPY and the U.S. has a business day, but Japan is open, then I count that a business day. Then, I divide by three. The division is easy when there are 21 business days; it divides evenly into three portions of 7s; however, when there are 22 business days, I generally give the mid-cycle the benefit, and use 7, 8, 7. Or if there are 23 business days that month, I use 7, 9, 7.
The idea behind this is that the large money players in the market, banks, funds, and other institutions, are most active at the beginning and end of a month, just as they are at the open and close of a day. Therefore, sometimes, not always, a market may pick up a particular trend in the opening phase of a month, then this trend will tend to stall out or reverse in the middle of the month only to once again trend near the end of the month.
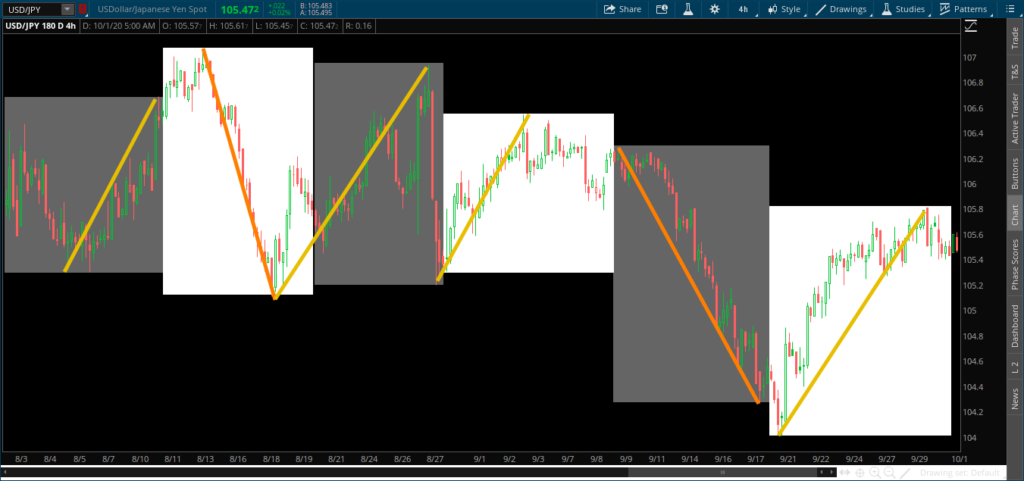
What matters is if we can find any example where such price action takes place. In the chart below, I will use the U.S. dollar vs. Japanese yen (USD/JPY) currency pair. Shown are four-hour bars from the last two months (August and September). Each box of the chart shows the three phases from each month, highlighting the trading range.

August – Cycle 1
I will give a brief commentary beginning from the left, moving right. In the first cycle of August, there was something of a “fake-out” at a few days in; it appeared the market was going to sell before rallying heavy.
August – Cycle 2
When the USD/JPY reached mid-August, I looked for the rally to begin to top out and potentially reverse as early month buy power might have maxed out. Fortunately, this played out successfully as the market sold off with more intensity than I expected.
August – Cycle 3
A trending month will often close similar to how it opened. In this final cycle of August, once participants re-entered the market late in the month, it again rallied back near the high.
September – Cycle 1
Once again, this initial cycle rallied, this time it was much clearer as the rally began at the month’s open.
September Cycle 2
However, that early month rally had already lost momentum by the time September rolled into midmonth. In this phase, there was a sharp reversal from the initial price action that lead to strong momentum selling.
September – Cycle 3
As the month transitioned into the final cycle, I looked for a bounce late in the month. Soon the market bottomed out, and then a strong rally occurred as once again, the market closed in the same trend as it opened.
As you can see from this chart, just because the month rolled into the next phase does not mean that it’s time to fade the price action. In many cases, this would not work the first day or two. However, what it does suggest is a more macro or wider view of the market and an indication of how price action may serve for the following 7 trading days. It is still necessary to use whatever indicators you have to assist you in a precise entry, however, once you have a working trade, this may give you confidence that there are other dynamics in your favor.