Home › Market News › Grain Futures, Fed Rates, and Chaos Trading Hedge Risk
The Economic Calendar:
MONDAY: PMI Composite, Factory Orders, ISM Services Index, 3-Month Bill Auction, 6-Month Bill Auction, Investor Movement Index
TUESDAY:
WEDNESDAY: MBA Mortgage Applications, International Trade in Goods and Services, EIA Petroleum Status Report, 4-Month Bill Auction, Consumer Credit
THURSDAY: Jobless Claims, Wholesale Inventories, EIA Natural Gas Report, 4-Week Bill Auction, 8-Week Bill Auction, Fed Balance Sheet
FRIDAY: Quarterly Services Survey, Baker Hughes Rig Count
Futures Expiration and Rolls This Week:
FRIDAY: Equity Index futures and Currency futures roll from June (M) to September (U).
Key Events:
Easing debt ceiling worries propelled stocks higher last week, with S&P and Nasdaq 100 higher by +1.88% and +1.79%. Debt ceiling fears diminished as the Senate voted to approve a bill to raise the U.S. debt ceiling for two more years.
Last Friday, the U.S. economy added 339,000 nonfarm payroll jobs last month while the unemployment rate rose to 3.7%. This marked the 14th consecutive month that job creation exceeded what Wall Street economists had expected.
Here are a few statistics on S&P 500 stock index futures:
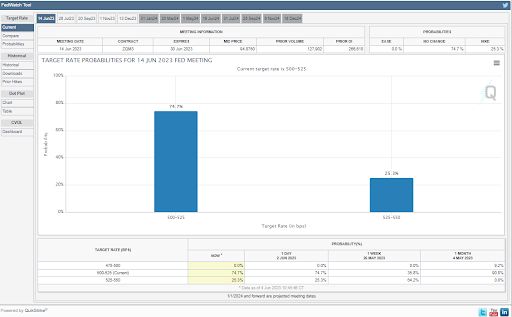
Raising or keeping rates unchanged is the big decision at the June 13-14 Fed meeting.
Key FOMC decision-makers, such as Chair Powell, Board Vice-Chair Jefferson, and FOMC Vice-Chair Williams, have communicated that they want to wait and assess the impact of the past year’s interest rate hikes.
We expect their view to prevail at the June 14 FOMC decision. The market is pricing the probability of no rate change at 74%, although a week ago, traders priced in chances for a 25 basis point rate hike at 64%.
Higher rates for longer! Official dot plot projections, to be released after the upcoming FOMC meeting, will likely indicate further rate increases, with only modest cuts starting in 2024. If there is a pause in rates, it will probably be short-lived.
U.S. Treasury yields compared to the last week:
30-Year yield 3.88% vs. 3.96%
10-Year yield 3.69% vs. 3.81%
5-Year yield 3.84% vs. 3.93%
2-Year yield 4.50% vs. 4.56%
2-10 Yield spread -0.90% vs. -0.75%
The Saudi energy minister followed through on his warning to oil futures short sellers. The OPEC+ weekend meeting delivered production cuts, and the Saudi’s cut of 1 million barrels per day will start in July.
Crude oil futures prices traded 3.3% higher as of Sunday evening.
On May 23, Prince Abdulaziz bin Salman warned oil market speculators to “watch out” as they could face further pain ahead. Some traders read this as hinting at further supply cuts.
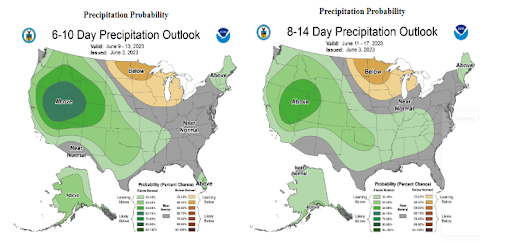
Grain futures are starting to perk up to recent dry weather conditions.
The need for rain in the Midwest is immediate, and below-normal precipitation in the grain belt is forecast for another 6-10 days. If mid-June rain fails to materialize, a sharp rally could unfold as crop yield reductions start to be discussed.
The weather forecast and dry weather for the next 30 days may be less impactful for soybeans than corn.
Our world has become more extreme—pandemics, sovereign debt, climate change, wars, cyberattacks, and political radicalization.
Mayhem is bearing down on investors and traders everywhere we look, putting trillions of assets at risk. As a result, a few traders and hedge funds are specializing in creating “doomsday” portfolios that hedge against the chaos.
A few well-known traders that structure “chaos” trades are Nasim Taleb, author of the book “The Black Swan,” and Mark Spitznagel, founder of Universa Fund. According to audited results, Universa’s Black Swan Protection Protocol Fund has posted a 15-year average annual return on capital of over 100%.
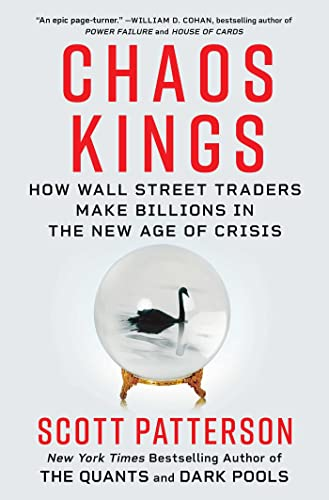
If you want to learn more about “chaos” strategies, The Wall Street Journal’s Scott Patterson is releasing a new book on June 6 – “Chaos Kings: How Wall Street Traders Make Billions in the New Age of Crisis.”
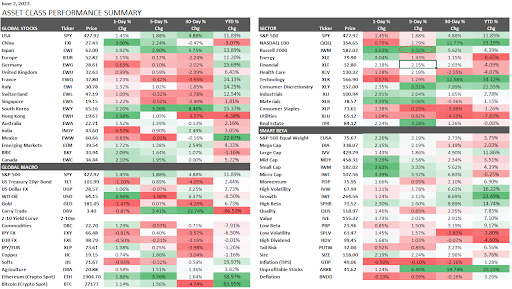
This performance chart tracks the daily, weekly, monthly, and yearly changes of various asset classes, including some of the most popular and liquid markets available to traders.