Home › Market News › Gold Futures Aiming For New Highs
The Economic Calendar:
MONDAY: Wholesale Inventories, 3-Month Bill Auction, 6-Month Bill Auction, Investor Movement Index
TUESDAY: NFIB Small Business Optimism Index, 3-Yr Note Auction, Austan Goolsbee Speaks
WEDNESDAY: MBA Mortgage Applications, CPI, Thomas Barkin Speaks, Atlanta Fed Business Inflation Expectations, EIA Petroleum Status Report, 4-Month Bill Auction, 10-Yr Note Auction, FOMC Minutes, Treasury Statement
THURSDAY: Jobless Claims, PPI, EIA Natural Gas Report, 4-Week Bill Auction, 8-Week Bill Auction, 30-Yr Bond Auction, Fed Balance Sheet
FRIDAY: Retail Sales, Import and Export Prices, Industrial Production, Business Inventories, Consumer Sentiment, Baker Hughes Rig Count
Futures Expiration and Rolls This Week:
There are no expiration or rolls this week
Key Events:
Stock indexes ended higher last week. The S&P 500 gained 1.36% for the week, and the Nasdaq index climbed 0.75%.
Stocks were volatile last week due to signs of a slowing economy, including weak ADP private payroll data and job openings. That changed from the previous narrative when traders cheered weak economic numbers.
Stock market traders are contemplating whether recession or rate hike worries are more meaningful to prices.
A few key short-term levels for the S&P 500:
Upside: 4160,4210,4220
Downside: 4083, 4055-60,4020
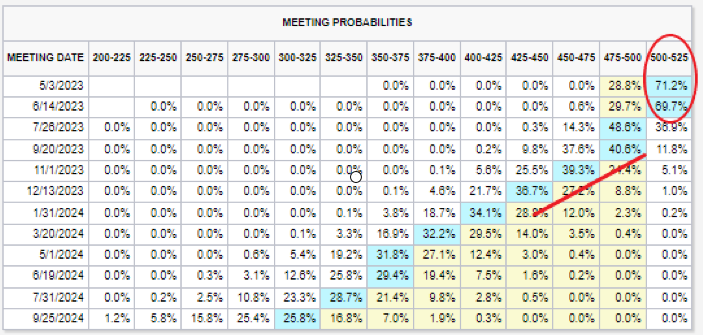
Current Fed Funds futures pricing shows a 71% probability of a hike and a 28% of a pause at the next Fed meeting on May 3rd.
Markets are then pricing in more than three rate cuts by year-end. So the CPI release this week will be necessary to maintain this more dovish pricing (see graphic below).
Our base case view: The credit tightening resulting from the current banking turmoil should be contained. It will not likely be large enough to push the economy into recession and force the Fed to ease aggressively to the extent markets appear anticipating.
U.S. Treasury yields current yield compared to the last newsletter:
30-Year yield 3.62% vs. 3.65%
10-Year yield 3.41% vs. 3.47%
5-Year yield 3.51% vs. 3.58%
2-Year yield 3.99% vs. 4.029
2-10 Yield spread -0.58% vs. -0.55%

Gold futures are trading higher and through key levels above $2000. The most active June (M) 2023 contract settled at $2039.40. That puts gold within striking range of the all-time high of $2088.
Weak U.S. economic data was the primary fundamental event that started the gold futures rally. In addition, data suggests the Federal Reserve could slow and pause rate hikes sooner than expected.
Also, China’s on a gold buying spree as the latest data from the People’s Bank of China bought 18 tonnes last month.
Analysts say that China is expected to continue to increase its official gold reserves as it builds international credibility for the yuan and competes with the U.S. dollar as a world reserve currency.

Traders will be focused on the U.S. CPI report for March this Wednesday. It follows a downside surprise in the latest PCE report for February, as well as an array of weaker-than-expected data this week, with markets increasingly focusing on the growth outlook and the likelihood of a recession.
Economists see a +0.3% Month-Over-Month increase for the headline rate and a consensus of 5.2% for Year-Over-Year inflation.
S&P 500 Q1 earnings season will kick off this Friday. Large Financial stocks, including BlackRock, Citigroup, and J.P. Morgan, will announce earnings.
Over the next few weeks, 87% of the index will release Q1 earnings results by May 5th. The analysts expect EPS to fall 7% YoY, the most significant decline since 3Q 2020.
Analysts project the Materials, Health Care, Communication Services, and Info Tech sectors are expected to announce year/year EPS growth declines. However, on the more positive side, Energy, Industrials, and Consumer Discretionary sectors are expected to post year/year EPS growth.
Valuations for stocks overall are also high historically, with the S&P 500 trading at about 18 times forward earnings estimates compared to its long-term average P/E of 15.6x, according to Refinitiv Datastream. Note below the stretched P/E ratio of NVDA at 159x and the Software Applications industry.
Morgan Stanley strategists said earnings estimates were 15-20% too high even “before the recent banking events.”
Can you say “Mega Bull” on the future of Bitcoin?!

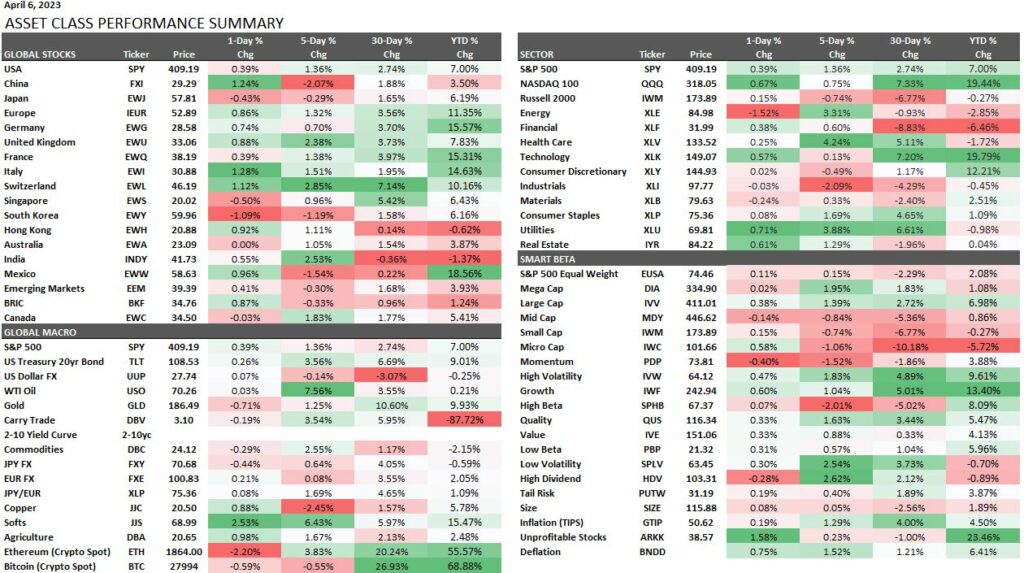
This performance chart tracks the daily, weekly, monthly, and yearly changes of various asset classes, including some of the most popular and liquid markets available to traders.

Just because you had a losing day using your current trading strategy doesn’t mean you return to the drawing board and start changing stuff.
Trust me! It won’t change anything. So please stick to your trading plan and track for at least 30 days before you make significant changes.
