Home › Market News › CTA Trading Volume, the Strategic Oil Reserve, and a Week Full of Jobs Data

The Economic Calendar:
MONDAY: Factory Orders (9:00a CST)
TUESDAY: U.S. Services PMI (8:45a CST), ISM Services (9:00a CST), Job Openings (9:00a CST)
WEDNESDAY: ADP Employment Report (7:15a CST), U.S. Productivity (7:30a CST), U.S. Trade Deficit (7:30a CST), EIA Petroleum Status Report (9:30a CST)
THURSDAY: Initial Jobless Claims (7:30a CST), Wholesale Inventories (9:00a CST), EIA Natural Gas Report (9:30a CST), Consumer Credit (2:00p CST)
FRIDAY: U.S. Employment Report (7:30a CST), Consumer Sentiment (9:00a CST)
Key Events:
Analysts expect an increase of 175,000 nonfarm payrolls in the U.S. economy for November.
While this would mark a faster pace compared to the 150,000 added in October, it remains below recent averages (3-month average of 204,000, 6-month average of 206,000, and 12-month average of 243,000).
The unemployment rate is expected to hold steady at 3.9%. Federal Reserve projections in September anticipated a year-end rate of 3.8%, with forecasts indicating a rise to 4.1% in 2024.
Moody’s analysts note that multiple indicators suggest an ongoing slowdown in various aspects of labor market activity.
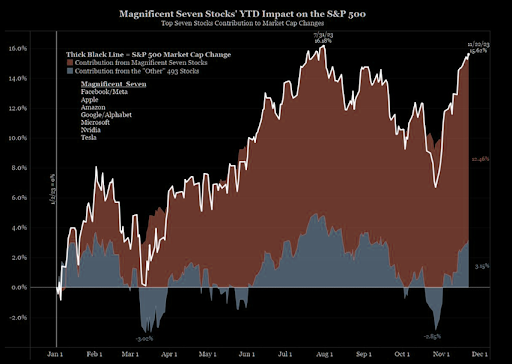
The graph below is an excellent reminder that most of the stock market has had a pretty terrible year, even though the magnificent seven have doubled.
As traders set up for 2024, one key question is whether U.S. small caps or non-US equities are attractive enough to outweigh U.S. large caps in the new year.
Treasury yields fell again when traders readjusted positions after Fed member’s comments.
Fed Governor Christopher Waller, a hawkish voice at the central bank, clearly indicated the Fed’s rate hiking was over as the current monetary tightening has reduced inflation.
Waller says, “I am increasingly confident that policy is currently well positioned to slow the economy and get inflation back to 2%,” he said and also “reasonably confident” of doing so without a sharp rise in the unemployment rate, now at 3.9%.
In later comments interpreted as signaling that rate cuts could be considered next year, Waller said there was “no reason” to insist rates stay “really high” if inflation continues to decline consistently.
On Friday, Fed Chair Jerome Powell offered the strongest signal that officials are likely done raising rates by saying that their policy setting is “well into restrictive territory, meaning that tight monetary policy” is slowing economic activity.
But Powell’s comments were laced with caution. “It would be premature to conclude confidently that we have achieved a sufficiently restrictive stance.”
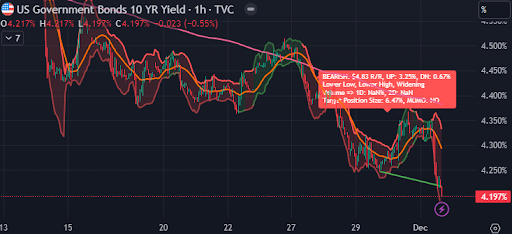
Source: Tradingview
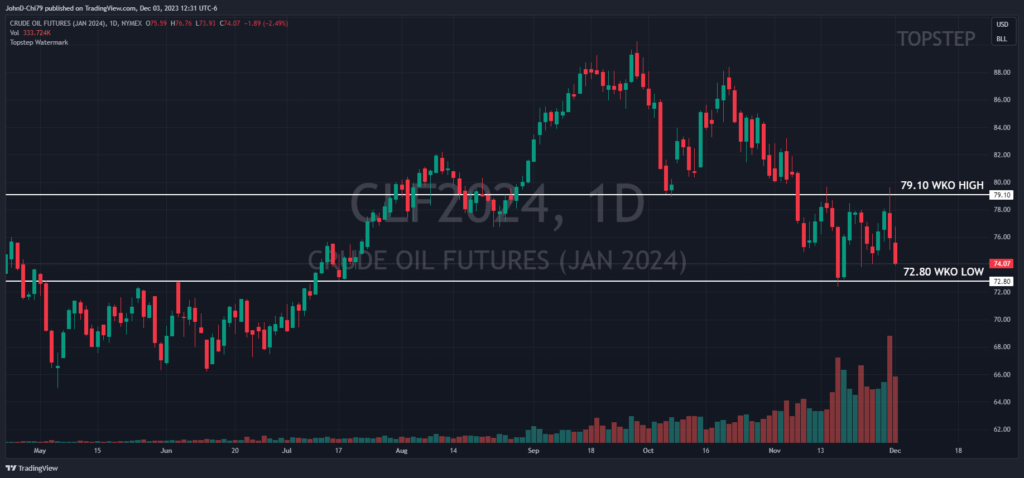
The OPEC+ additional supply cut was right on the whisper number, but traders took it as a “Sell The News” event.
Crude oil prices (CL) initially traded higher on the report and then reversed. Oil prices exhibited a sense of disappointment in response to the OPEC+ cartel’s decision to implement a voluntary 2.2-million-barrel oil production cut, a widely perceived unnecessary move.
Despite OPEC fostering expectations that led to a significant rally, the market remained skeptical about OPEC’s ability to fulfill its commitments.
The cartel’s voiced frustration with speculators and algorithmic traders was a significant factor that motivated this decision, attributing volatility and market turbulence to their activities.
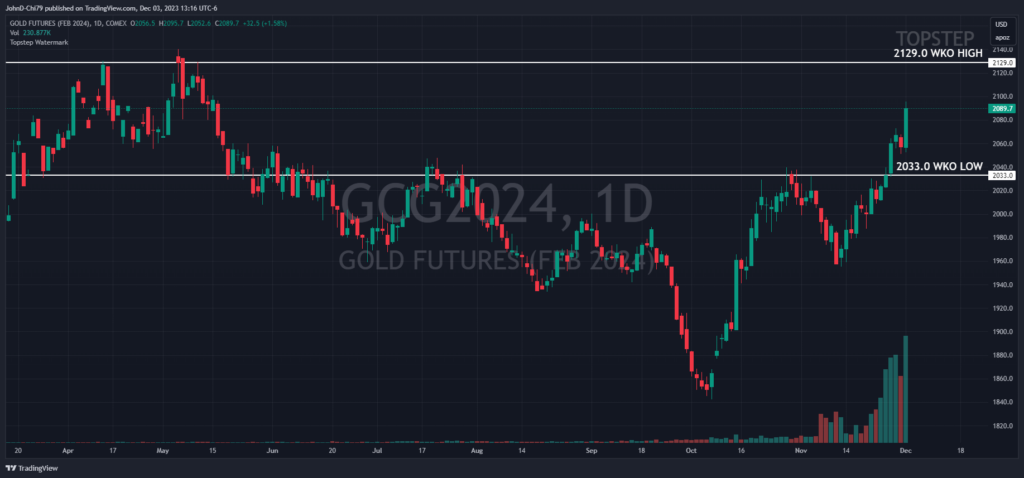
Gold futures achieved a six-month pinnacle, settling at $2,071 an ounce.
A growing consensus among traders that the U.S. Federal Reserve has concluded its interest rate hikes and a concurrently weaker U.S. dollar helped propel the surge.
Analysts also underscore the continued support for gold prices, emphasizing the persisting geopolitical risk in the Middle East, albeit currently contained.
Despite the positive trajectory, a Bloomberg report cautioned that gold’s potential upward movement might face constraints this time. The relative overextension of gold compared to Treasury yields and the dollar poses challenges, leading investors in exchange-traded funds to approach the rally cautiously.
Ole Hansen from Saxo Bank highlighted in a recent commentary that gold has historically exhibited robust performance in December over the past six years, with gains ranging from 2.2% in 2017 to a notable 6.8% in 2020, coinciding with a substantial 16.6% surge in silver prices.
Navigating the trading landscape has become an increasingly turbulent journey. While supply-and-demand dynamics still guide commodity prices’ traditional ebb and flow, speculative forces now heavily influence the daily dynamics of trading futures.
At the forefront of this volatility are not just general speculators but a cohort of algorithmic money managers referred to as commodity trading advisors (CTAs). CTAs have become a formidable presence in commodity and futures markets.
Recent estimates and an example say CTAs account for only one-fifth of managed money participants in U.S. oil futures. However, CTAs have contributed nearly 60% of the managed money group’s net trading volume this year, as indicated by Bridgeton Research Group’s analytics on computer-generated trades.
This proportion represents the highest share held by CTAs since data tracking back to 2017. According to Bloomberg, while quantifying the precise extent of total trading volumes under CTA control is challenging, algorithms, broadly speaking, drive up to 70% of crude trades on an average day, according to data from TD Bank and JPMorgan.
Talks to speed up the purchase of 4 million barrels of oil for the Strategic Petroleum Reserve (SPR) to February 2024 from summer 2024.
Last year, President Joe Biden conducted the largest sale ever from the SPR of 180 million barrels to fight rising oil prices.
Since the beginning of 2023, the department said it has now repurchased nearly 9 million barrels at an average price of $75 a barrel, about $20 lower than the $95 average price for last year’s emergency sales. It said the return from the exchange means more than 12 million barrels will have been bought or returned through February.
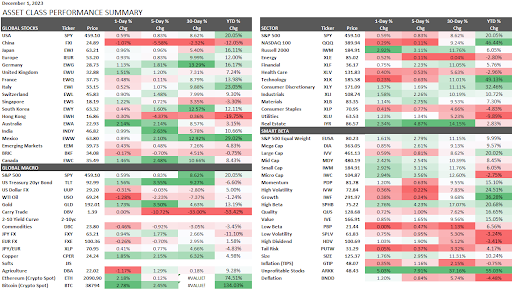
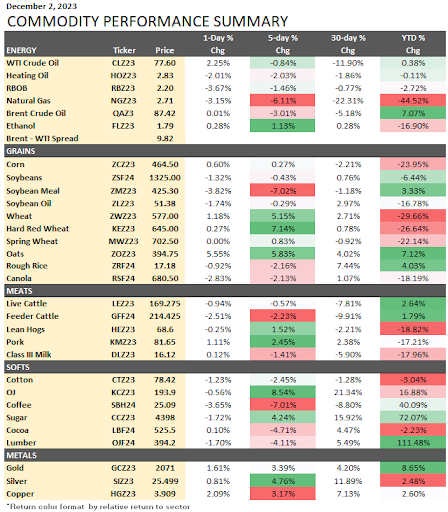
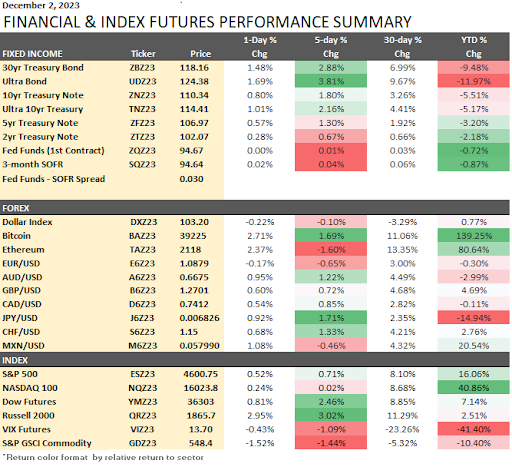
These performance charts track the daily, weekly, monthly, and yearly changes of various asset classes, including some of the most popular and liquid markets available to traders.