Home › Market News › Copper Futures, Stagflation, and a Heavy Economic Calendar

The Economic Calendar:
MONDAY: Dallas Fed Manufacturing Index (9:30a CT)
TUESDAY: Employment Costs (7:30a CT), Redbook (7:55a CST), Housing Price Index (8:00a CT), Case-Shiller Home Price Report (8:00a CT), Chicago PMI (8:45a CT), Consumer Confidence (9:00a CT), Dallas Fed Services Index (9:30a CT), 2-Day FOMC Meeting Begins
WEDNESDAY: MBA Morgage Applications (6:00a CST), ADP Employment Report (7:15a CT), Treasury Refunding Announcement (7:30a CT), S&P Global Manufacturing PMI (8:45a CT), Construction Spending (9:00a CT), ISM Manufacturing Index (9:00a CT), JOLTs (9:00a CT), EIA Petroleum Status Report (9:30a CT), Fed Rate Decision (1:00p CT), Fed Chair Press Conference (1:30p CT)
THURSDAY: Challenger Job Cuts (6:30a CT), Jobless Claims (7:30a CT), Balance of Trade (7:30a CT), Import/Export Prices (7:30a CT), Factory Orders (9:00a CT), Vehicle Sales (9:00a CT), EIA Natural Gas Report (9:30a CT)
FRIDAY: Unemployment Rate (7:30a CT), S&P Global Composite PMI Final (8:45a CT), ISM Services Index (9:00a CT), Baker Hughes Rig Count (12:00p CT)
Key Events:
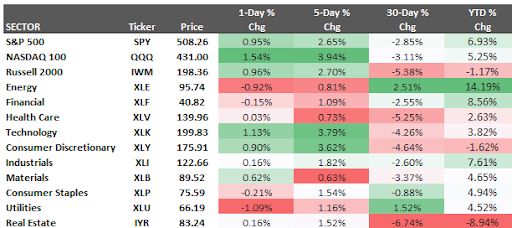
The S&P 500 and Nasdaq 100 surged last week, closing up 2.65% and 3.94%, respectively. This positive performance can be attributed to strong earnings reports from tech companies, particularly those in the AI and cloud computing sectors.
These results fueled optimism about continued growth in these areas, overcoming concerns about potential interest rate hikes by the Federal Reserve.
A significant trend has emerged, with nearly a third of S&P 500 companies reporting earnings. Around 80% have surpassed analyst estimates, with overall earnings growth climbing to nearly 7%. This aligns with initial forecasts for the first quarter and represents a rebound after a dip earlier in the month. Blended first-quarter earnings estimates, which combine reported results with forecasts for remaining companies, have also returned above 3%.
Key Takeaways:
Last week’s economic data brought back unwelcome memories of the 1970s phenomenon – stagflation, a period of high inflation combined with sluggish economic growth.
The Bureau of Economic Analysis (BEA) reported U.S. GDP growth at a mere 1.6%—the slowest rate in nearly two years. This fell short of analyst expectations of 2.4% growth, and stock markets reacted negatively to this news.
While Treasury Secretary Janet Yellen attempted to downplay the data’s severity, highlighting underlying economic strength, the inflation picture remains concerning. The Personal Consumption Expenditures (PCE) price index, a key inflation measure for the Federal Reserve, rose to 3.7%, exceeding the 2% seen in the previous quarter. This sticky inflation presents a significant challenge for central bankers navigating the economic landscape.
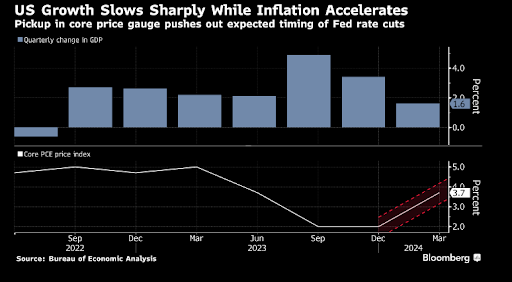
Source: Bloomberg
At Wednesday’s meeting, the Federal Open Market Committee (FOMC) is widely expected to maintain the current federal funds rate target range of 5.25% to 5.50%. This decision comes amidst conflicting economic signals.
On one hand, recent data suggests persistent inflation (“sticky inflation”) and a potential slowdown in economic growth. This may encourage the Fed to remain cautious and hold rates steady. However, the minutes from the March meeting revealed that most FOMC participants anticipate a shift towards a looser monetary policy stance (“less restrictive or dovish”) later this year.
Market participants will be closely attuned to how Chair Powell addresses recent increases in inflation data. Following the March Personal Consumption Expenditures (PCE) report, traders initially priced around 0.36% (36 basis points) of rate cuts by year-end.
While the FOMC’s March economic projections forecast three rate cuts this year, bringing the target range down to 4.50% to 4.75%, recent hawkish comments from some Fed officials have tempered expectations. Currently, financial markets only fully expect one rate cut by the end of 2024.
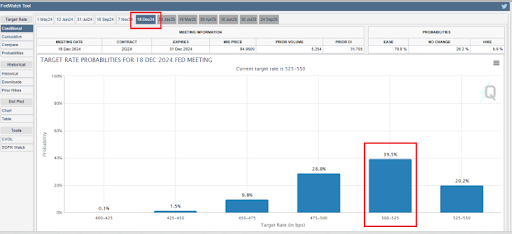
Source: CME FedWatch
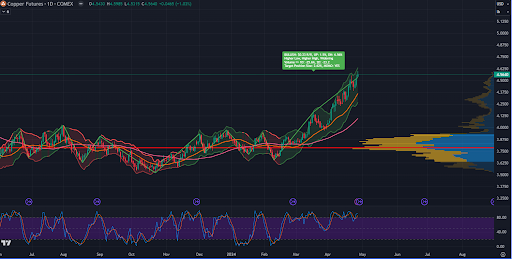
Copper futures are experiencing a significant upswing, reaching a new two-year high. This surge can be attributed to a confluence of factors creating a “perfect storm” in the copper market.
Takeaways:
Finally, the recent news of BHPs proposed $39 billion takeover of Anglo-American adds another layer to the story. This potential merger would create the world’s largest copper miner, further consolidating the industry. This consolidation trend suggests industry giants are preparing for a future with sustained high demand for copper.
Crude Oil futures had a rollercoaster ride this week. Initially, they dipped after the GDP report, likely due to concerns about stagflation – a combination of stagnant economic growth and high inflation. However, the trend reversed later in the session.
Analysts believe the underlying factors for oil are quite positive. They point to two key drivers: geopolitical tensions and a looming supply shortage. Geopolitical tensions, which can disrupt oil production and exports, are a constant worry in the market. Additionally, analysts predict record demand for oil next month, which could outpace supply and push prices even higher.
The natural gas market is currently navigating a complex landscape. While storage reports indicate a significant supply surplus, prices haven’t fallen as dramatically as some might expect. Let’s delve into the key factors influencing this situation:
Additional Information:
The quote from Bruce Kovner, American billionaire hedge fund manager of CAM Capital:
“I know where I am getting OUT, before I get IN!”
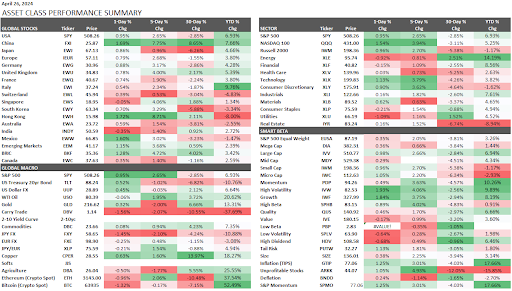
These performance charts track the daily, weekly, monthly, and yearly changes of various asset classes, including some of the most popular and liquid markets available to traders.