
By Daniel P. Collins
There are various technical trading indicators to help traders build technical systematic trading strategies. Some, such as the Moving Average Convergence Divergence (MACD) indicator, are better as a standalone signal generator. In contrast, others, like the Relative Strength Index (RSI), work best as a filter or overlay with other indicators or systems.
Every indicator is based on some sort of mathematical model or average and provides valuable data. The important thing for traders is to understand what they are showing and what they aren’t. They are not predicting moves but providing specific data that can be studied to find tendencies in the market that can be used to create an edge.
The beauty of most indicators is in their simplicity. This is especially true with the Average True Range (ATR). The ATR falls into the category of a filter or overlay indicator that can be used to measure momentum, trend, and, most of all, volatility.
It is simply an average of the previous period’s (usually 14) true ranges.
Calculation
ATR = (Previous ATR * (n – 1) + TR) / n
Where:
ATR = Average True Range
n = number of periods or bars
TR = True Range
The True Range is the greatest of the following:
- Today’s high minus today’s low
- The absolute value of today’s high minus yesterday’s close
- The absolute value of today’s low minus yesterday’s close
The true range calculation can include the previous day’s close when there is a gap opening. David Wilder explained, “In this way, both directional and non-directional movement can be captured and quantified, while gap openings are properly accounted for (see “Unlocking the volatility key using ATR,” Futures, December 2008).
Its creator, J. Welles Wilder, wrote, “The one thing that is directly proportional with volatility is range.”
While there are some much more complicated measures of volatility, the beauty of ATR is in its simplicity. For example, the Cboe Volatility Index (VIX)—the standard measure of volatility for equity markets, which uses a complex combination of options prices to calculate volatility—often doesn’t show upside volatility. Since futures (which Wilder designed ATR for) has no bias between long and short positions, the simplest measure of volatility is the size and trends of market ranges over time.
Ironically, Wilder built his trend-following Volatility System primarily off of readings of the ATR. Today most traders use it in concert with order indicators to help select entries and exits, gauge risk within a trade, and to set stop levels.
Bramesh Bhandari wrote, “[ATR] is usually used to analyze the risk of taking a specific position in the market (See: “Trading the average true range,” Modern Trader, April 2017). In addition, it is often used as a way to calculate stop-loss and profit targets (by applying a multiplier).”
The US Dollar Index chart below shows how ATR reflects the narrowing size of the daily ranges.
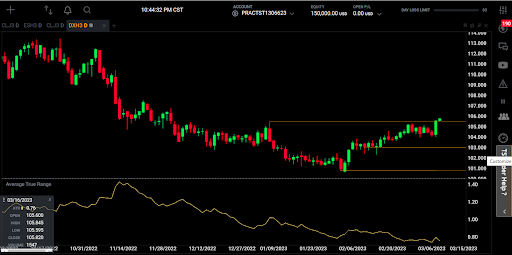
Source: TSTrader
While this does not suggest a market direction, it does indicate the likely range in either direction. With this knowledge, a trader can determine if a trade entry is advisable.
The dollar recently broke an important resistance level from January, indicating a potential long entry (top line). However, the narrowing ATR would suggest a relatively tight stop. Wilder suggested taking the ATR and multiplying it by three to create a reversal trade. Using this, a trader would need to determine an appropriate support level to place their stop, and if that is inside the ATR x 3, they would take the signal.
The chart shows two possible support levels where a trader would put a stop loss (or stop and reverse). The middle line is the low close following the near-term breakout, while the bottom line shows the long-term low close.
The dollar chart shows a strange condition. Typically market volatility tends to increase during sell-offs and decrease during rallies. There is a saying that markets take the stairs up and the elevator down.
Recent E-mini S&P price action illustrates this (see chart).

Source: TSTrader
Notice how the ATR declined all through last summer’s rally and expanded during the fall sell-off.
Breakout trades are usually indicated by a series of lower highs and higher lows in a market (see the crude oil chart below).
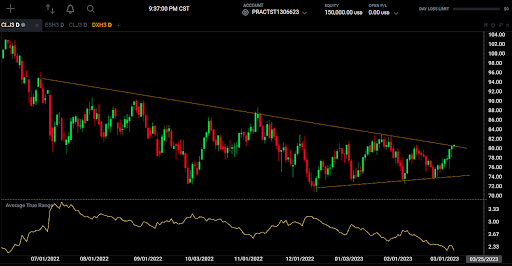
Source: TSTrader
Notice how the ATR is steadily decreasing as crude consolidates. A trader can enter a position in either direction based on a breakout of the consolidating range and use the ATR calculation to set a stop.
ATR is a measure of volatility that helps determine the risk in a trade. It can work in unison with other indicators to help the trader determine whether a potential trade is within that trader’s risk parameters.
Bhandari noted, “ATR should not be used as a standalone signal, but is valuable in confirming moves and in timing trades. Use ATR to determine when volatility is increasing and when it is contracting; this can help determine the best times to trade.”