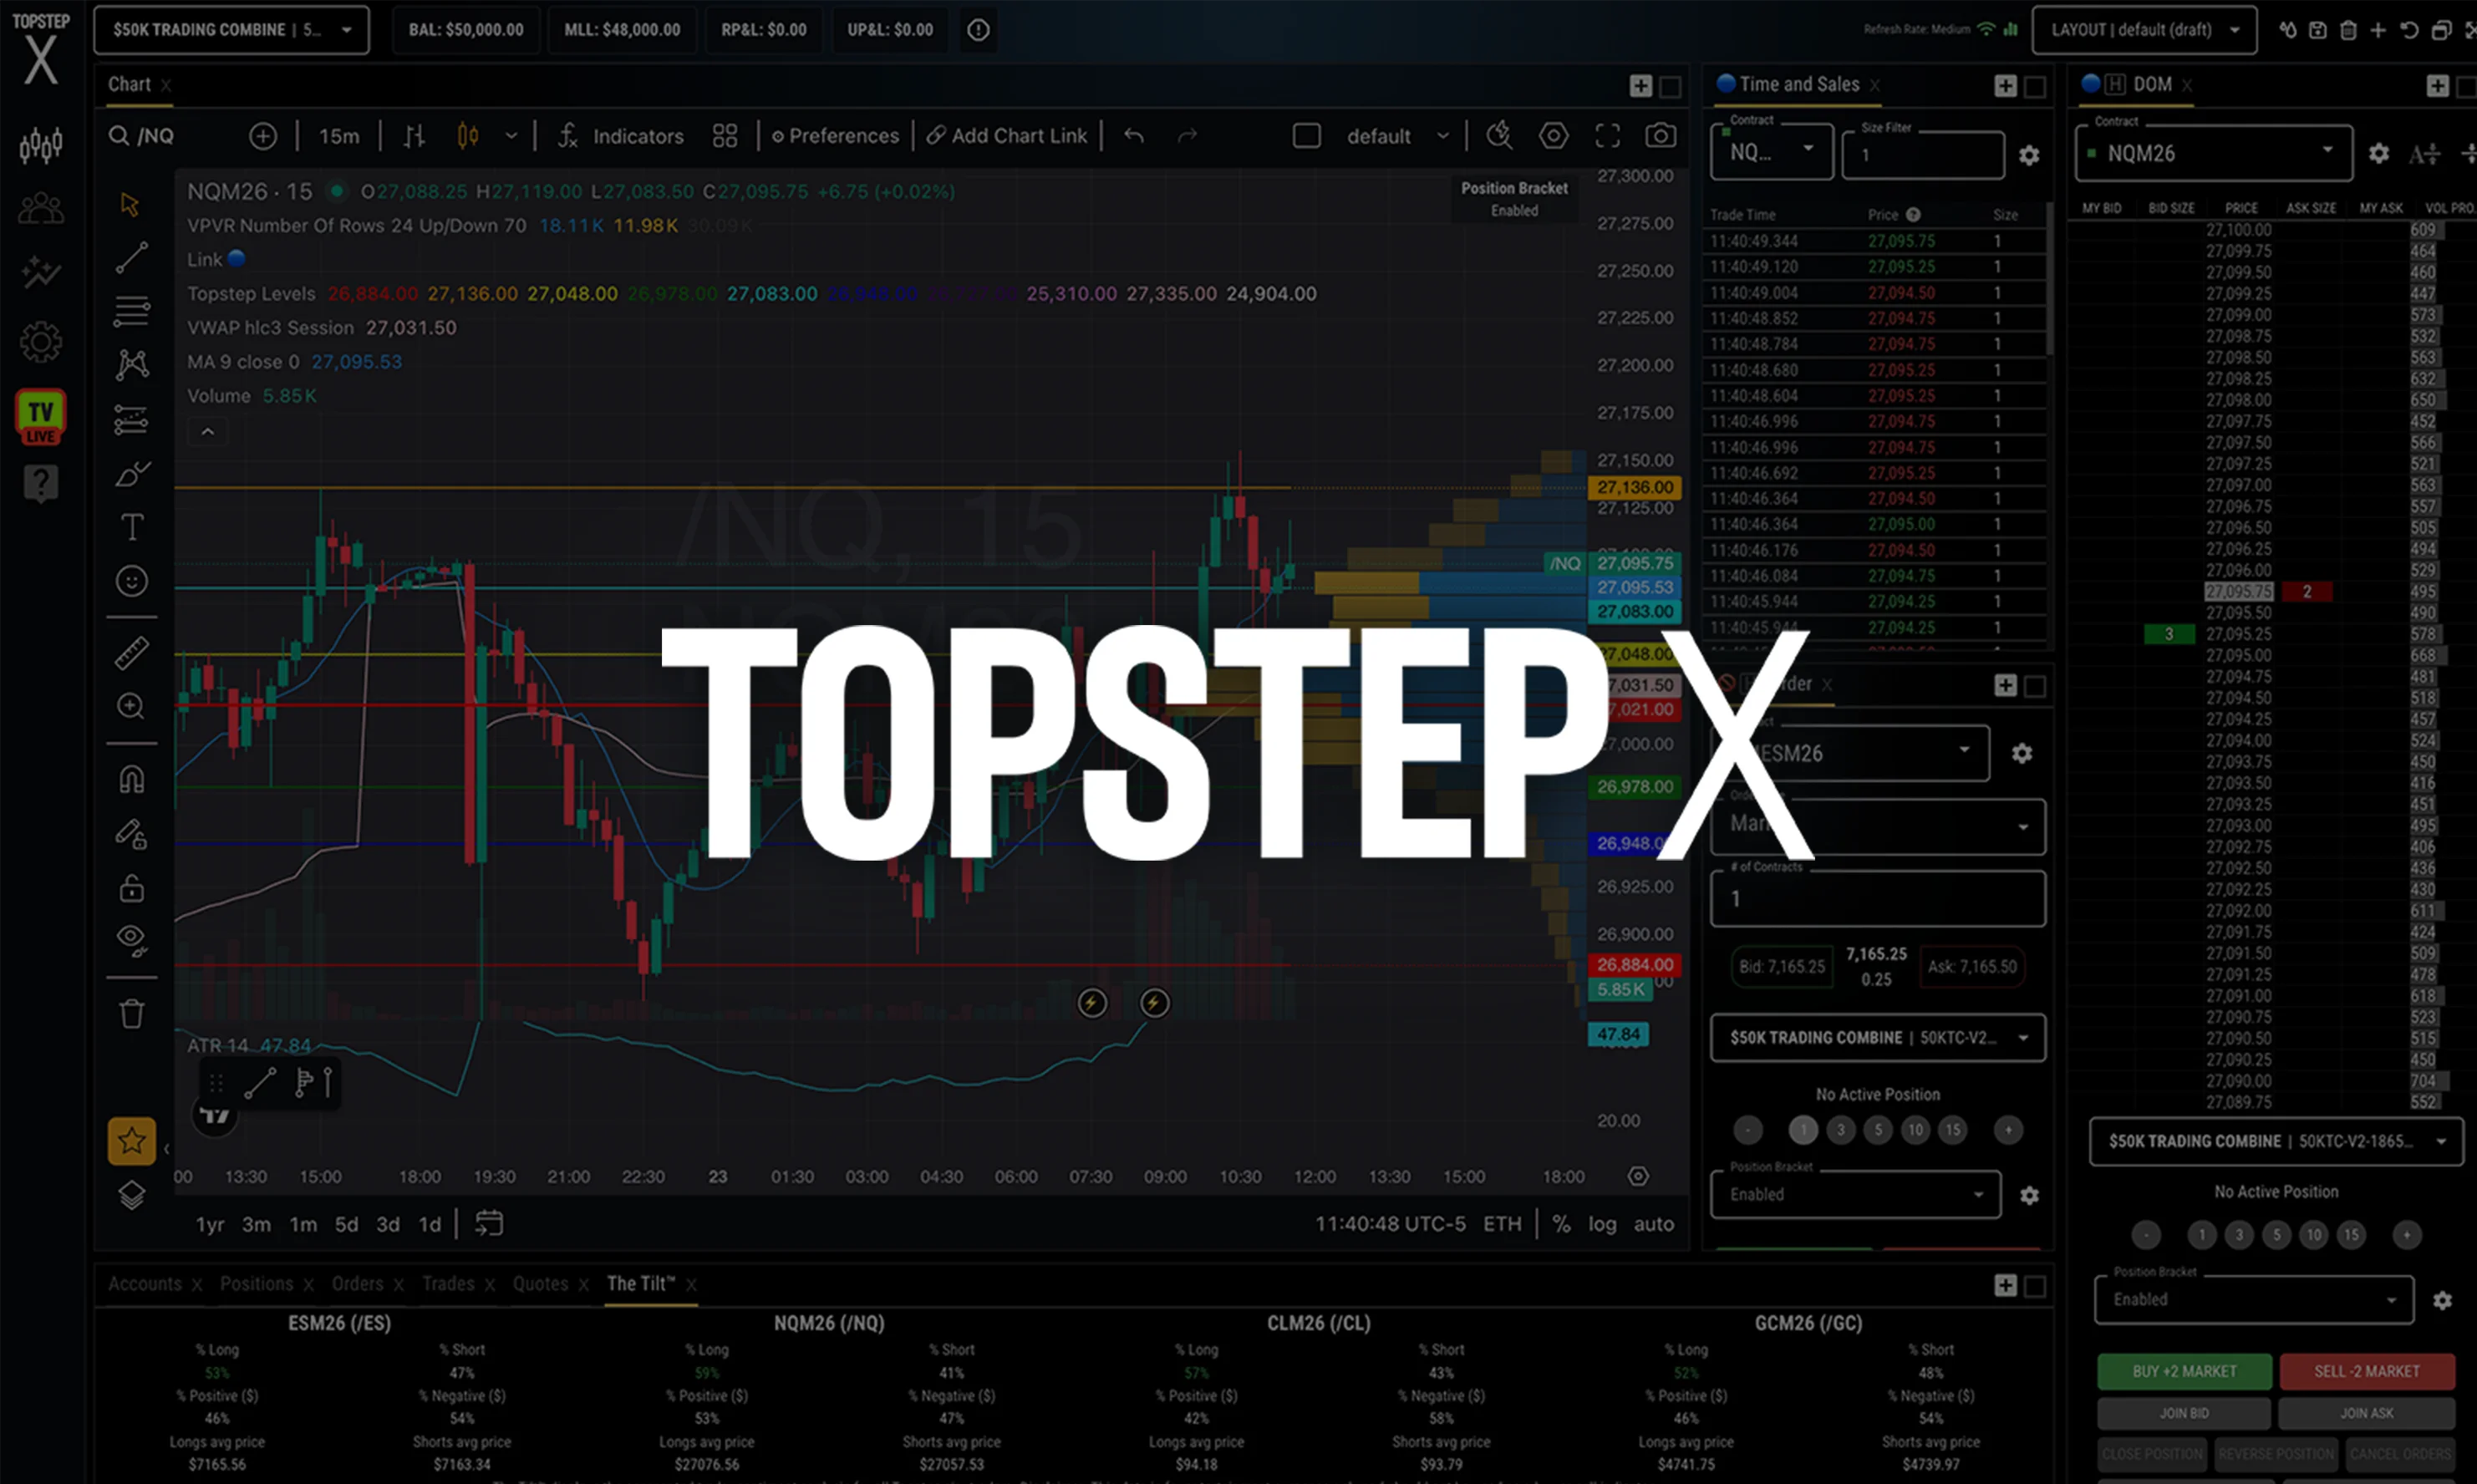

You asked. We built it.
The Ultimate Trading Experience keeps getting better, with new TopstepX™ updates dropping all summer long.
Some will help traders spot trades.
Some will help traders see the market in a whole new way.
Some may become part of their everyday trading routine.
Every week brings something new. Every release helps traders get more out of TopstepX.
Here's a look at the latest drops.
#1: Session Structure + Chart Utility Toolkit
Every trading day starts with the same questions:
Where are the key levels? What session are we in? What is price doing right now?
The first Summer of TopstepX release focused on helping traders answer those questions.
Together, these indicators provide the structural framework of the trading day and real-time context for every chart.
Sessions
What it does: Highlights the Asia, London, and New York trading sessions and their key levels.
Why traders use it: Track important market sessions and identify where key support and resistance levels may have formed.
Learn how to use Sessions on TopstepX.
Opening Range
What it does: Tracks the first minutes of the trading session and projects potential breakout targets.
Why traders use it: Identify potential breakout opportunities and objective price targets.
Watch how Opening Range works in TopstepX
Initial Balance
What it does: Maps the first hour's range to help traders identify balance and directional moves.
Why traders use it: Understand whether the market is balanced or beginning to trend.
See the Initial Balance indicator in action.
HA Trend
What it does: Uses Heikin-Ashi logic to smooth price action and highlight trend direction.
Why traders use it: Filter out noise and make trend direction easier to see.
Watch an HA Trend walkthrough on YouTube.
Price Info
What it does: Displays key price levels and market context directly on the chart.
Why traders use it: Monitor important price levels without cluttering the chart.
Watch the Price Info indicator tutorial.
Session Structure Indicators Recap
Whether you're tracking overnight levels, watching opening ranges, or looking for a cleaner view of market direction, these tools help traders understand where the market has been and where it may be headed next.
Put these tools to work on TopstepX and start building your path toward funding.
#2: Trend Toolkit
The difference between catching a trend and chasing one often comes down to seeing it sooner.
The Trend Toolkit gives traders more ways to identify market direction, spot potential trend changes, and filter out market noise.
Trend Magic
What it does: Helps traders determine whether a market is trending higher or lower and identify when momentum may be fading.
Why traders use it: See trend changes sooner and avoid fighting the market's direction.
Learn how to use Trend Magic on our YouTube channel.
SSL Hybrid
What it does: Combines multiple signals into a single view for additional confirmation.
Why traders use it: Get more confirmation before entering a trade without switching between multiple indicators.
See the SSL Hybrid indicator in action.
T3
What it does: A smoother version of a moving average designed to filter out smaller price fluctuations.
Why traders use it: Focus on the bigger move and avoid reacting to every market wiggle.
Watch how T3 works on our YouTube channel.
VIDYA
What it does: Automatically adapts to changing market conditions and market activity.
Why traders use it: Use an indicator that adjusts as markets speed up or slow down.
Watch a VIDYA indicator walkthrough on YouTube.
Trend Toolkit Recap
Used together, these Trend Toolkit indicators give traders more ways to read the market and stay one step ahead.
Spotting trends is a skill. Start a Trading Combine® and build it one trading day at a time.
#3: Oscillator Toolkit
Momentum often shifts before price makes its biggest move.
The Oscillator Toolkit gives traders more ways to monitor momentum, identify potential shifts, and better understand market conditions.
Wave Trend
What it does: Helps traders monitor changes in buying and selling pressure as momentum strengthens or weakens.
Why traders use it: Spot potential momentum shifts before the crowd.
See the Wave Trend indicator in action.
TDI (Traders Dynamic Index)
What it does: Combines trend, momentum, and volatility into a single indicator.
Why traders use it: Get a broader view of market conditions without relying on multiple indicators.
Watch the TDI indicator walkthrough.
Zero Lag MACD
What it does: Identifies momentum shifts with less delay than traditional moving average convergence divergence (MACD) indicators.
Why traders use it: React faster when market conditions change.
See the Zero Lag MACD indicator in action.
Trend Cycle
What it does: Helps traders identify whether markets are trending or moving sideways.
Why traders use it: Better adapt trading strategies to current market conditions.
Learn how to use the Trend Cycle indicator on YouTube.
Oscillator Indicators Recap
Together, these indicators provide additional context around momentum, trend strength, and market conditions.
Ready to see these indicators in action? Start trading on TopstepX today.
New TopstepX indicators and features are still coming
The Summer of TopstepX isn’t over yet.
More indicators, charting tools, and platform enhancements are dropping all summer long.
Check back every week to see what's new in TopstepX.
And if you'd like a closer look, join Coach Robert live every Wednesday at 5:00 p.m. CT in Discord for a TopstepX Indicators Demo & Q&A. He'll break down the newest releases, show how traders are using them, and answer questions live.
Want to see what these tools can do? Start a Trading Combine for as low as $49 and begin your path toward becoming a Funded Trader.
Frequently asked questions
What is the Summer of TopstepX?
The Summer of TopstepX is a series of trading platform updates featuring new trading indicators, charting tools, and trading features designed to help futures traders get more out of their trading experience.
Which new indicators have been added to TopstepX?
Recent releases include Sessions, Opening Range, Initial Balance, HA Trend, Price Info, Trend Magic, SSL Hybrid, T3, VIDYA, Wave Trend, TDI, Zero Lag MACD, and Trend Cycle.
What are the best indicators for futures trading?
The best indicators help traders read sessions, spot trends, and catch momentum shifts. TopstepX's newest releases cover all three, giving traders more ways to understand what the market is doing in real time.
Are these indicators free to use on TopstepX?
Yes, every indicator covered here is built into the TopstepX platform at no extra cost. Just open a chart and add them like any other tool.
Do I need a funded account to access these TopstepX indicators?
No funded account required. These indicators are available across TopstepX, including during a Trading Combine, so you can start using them right away.
Where can I learn how to use trading indicators?
Beyond the walkthroughs linked above, join Coach Robert's weekly trading Discord sessions for live demos and Q&A, or explore the TopstepX community for tips from other traders.