
Most MACD indicators also include a histogram that measures the distance between the MACD line and the signal line. When the gap between these lines increases, it is a sign of increasing momentum. The histogram is plotted over a zero line; when MACD is above the signal line, the histogram will be above the zero line. If MACD is below its signal line, the histogram will be below the zero line.
While the MACD line is a calculation: MACD=12-Period EMA − 26-Period EMA, it serves as the fast line, with the signal line serving as the slow line. Think of it—for trading purposes— as two moving averages that when the fast (MACD line) crosses above the slow line (signal line), it is a bullish signal, and when the fast line crosses below the slow line, it is a sell signal.
The crude oil chart (below) shows several crossovers. The first signal shows the MACD line (yellow) crossing above the signal line just as crude oil breaks higher.
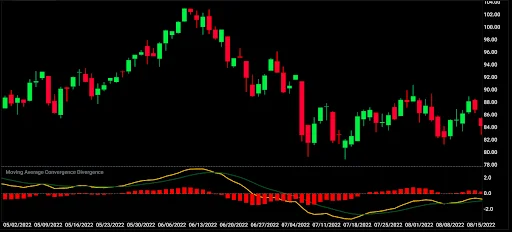
Bill DeBuse, a proprietary trader and author, wrote, “The most effective use of the MACD is achievable by interpreting where the moving averages cross, their relationship to the histogram and where they enter or exit it (see: “MACD: A Trader’s Indicator,” Modern Trader, October 2016).”
DeBuse added, “The consensus of most traders (is) the higher the moving averages cross, the stronger the potential decline.”
If there is a bullish cross, the lower the cross occurs, the stronger the rally. In the chart above, MACD crosses at a very high level, following a top in the crude chart, confirming that outlook.
In another article, DeBuse wrote, “If the fast average interacts with the beginning of the histogram, and if it can stay close to the outside of the histogram (pulling) the histogram along with it, the move is going to be sustainable (and) strong,” (see: “Wide & Deep: The Scope of MACD,” Modern Trader, November 2016).
That is precisely what happened in the E-mini S&P this past fall. On Oct. 13, the MACD line crossed the signal line. When it crossed the zero line, the move slowed, but MACD was able to drag the histogram along with a substantial move.
The two lines nearly touched in November, which could have signaled an exit or a divergent long signal.
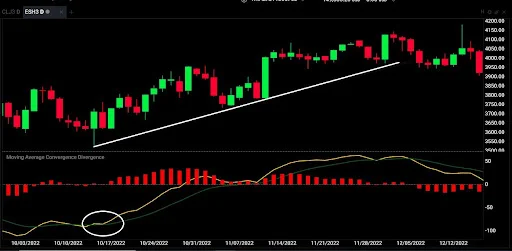
Notice that the initial cross occurred well below the zero line.
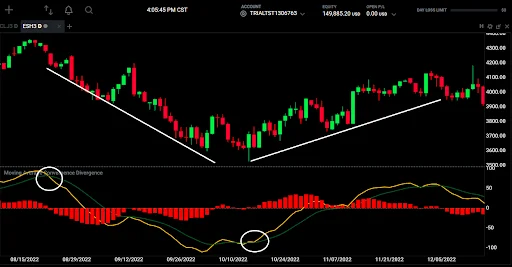
If we go back a few weeks, we will see the same action signaling a strong sell-off. In both cases, the cross occurred well above or below the zero line (see chart below).
MACD is one of the most versatile and accurate indicators for retail traders. It can be used on any timeframe. In addition, it is robust enough to use as a standalone indicator or can be used in tandem with other indicators to create unique trading strategies.