
The key point in identifying an ABC and AB=CD pattern is to correctly detect the A, B, and C key inflection (pivot) points in a chart while they are forming. These inflection points are determined by key swing highs and lows of various levels, and their correction waves to determine distinct swings. The potential C point is usually forecasted by the Fibonacci retracements (0.38 to 0.618) of AB Swing. Once A, B, and C points (and AB, BC legs) are identified, a projection algorithm is applied to compute the Potential Completion Zone (PCZ). This PCZ area is where the ABC pattern is expected to complete and may signal a continuation of its trend in the first trend direction (AB). Following the completion of the BC leg, the projections of AB and BC legs (using Fibonacci ratios) are plotted (from C) to generate targets. The ABC pattern is traded in the trend direction of AB from C to D.
“Know your ABCs,” below, show both ABC Bullish and ABC Bearish formations using trade information in TradeStation software.
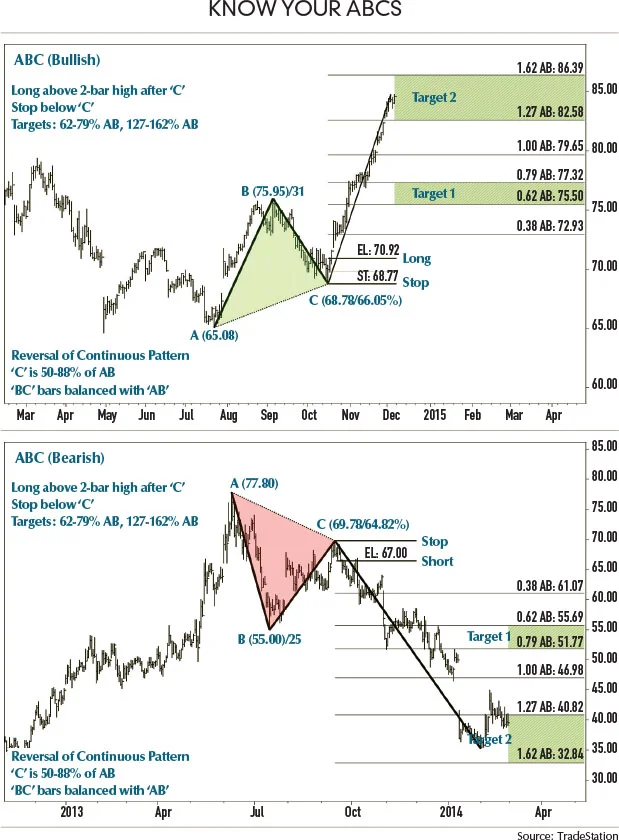
The swing legs (AB and BC) in the ABC pattern are generally in symmetrical proportions both in price and time with consistent slopes. The tradable CD leg has a harmonic relation with symmetry for AB and BC swings. The ABC bullish structures are formed after a prolonged prior downtrend or consolidation trends, whereas bearish ABC patterns are formed after a prior uptrend.
A PCZ is computed using AB swing and Fibonacci ratios (50-88.6% of AB). This PCZ area is where a “C” pivot is formed at the end of a BC swing that signals the completion of an ABC pattern.
How to trade it
After an ABC pattern is completed, it is advisable to wait for the pattern to confirm a reversal signal using any momentum-based indicator or price confirmation mechanisms. There are various confirmation and trade entry methods, but one of the best methods is when price crosses a 2-bar high after “C” in an ABC bullish pattern or a 2-bar low after “C” in an ABC bearish pattern.
A “Stop” is placed a few ticks below C (if bullish) or a few ticks above C (if bearish) levels.
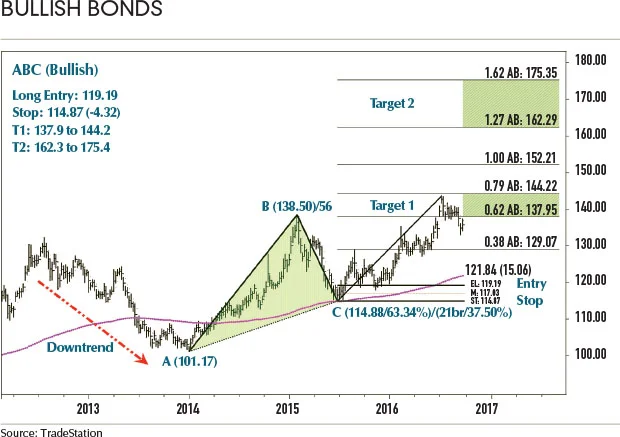
The ABC pattern targets are computed using the AB and BC swings. The height pattern (AB) is used to project target levels from C-level using Fibonacci ratios. The first target zone is (62-79% AB) from “C” and the second target zone is (127-162% AB). A secondary target level is set at 100% AB Level at 152.21.
The Fibonacci relationships aid in finding an approximate area (PCZ) where the pattern may be complete. Precise ratio levels for reversals or targets in patterns are very rare and a tolerance ratio of +/- 2% is added for the Fibonacci ratios. Pattern confluences with other patterns, support/resistance areas, moving averages, and other market context elements must be used to identify and validate the pattern structure.
Example -
“Bullish bonds” (below) show the auto-generated ABC bullish pattern formation in the current 20-year Treasury Bond ETF TLT chart from 2012 to 2016. Here are some of the key points and how it is traded.
- TLT was in a downtrend from 2012 to late 2013.
- From the beginning of 2014 to the beginning of 2015, TLT reversed its prior trend and formed AB Leg (A at 101.17 and B at 138.50).
- During 2015, TLT started to decline to 63.4% of AB leg and formed BC leg.
- After completion of the “BC” leg (7/24/2015), a reversal above 2-Bar high signals a long entry at EL: 119.19.
- A Stop is placed below “C” at 114.88 (-4.32).
- The first Target Zone is set at 137.95-144.22 and the second target zone is set at 162.29-175.35
- In July 2016, TLT reached its first target zone (137-144).
Author
Suri Duddella