
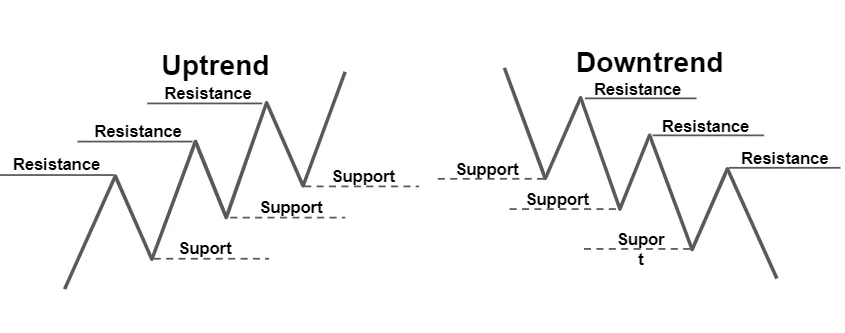
The definitions of support and resistance are straightforward enough; support is an area where more aggressive buyers meet sellers, and resistance is an area where more aggressive sellers meet buyers. The question is whether or not their roles will reverse when the area is violated, i.e., will resistance become support?
One way to get started doing this is by having a good understanding of the importance of trends. Simply put, in technical analysis, the trend is the longer-term direction the market is moving.
The basic concepts of trend are fairly universal; there are only three directions a market can be moving:
- Higher
- Lower
- Sideways
That’s it.
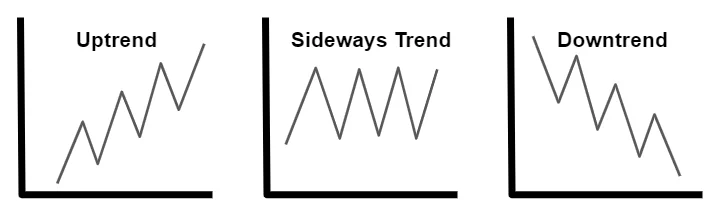
A market trending higher, or an uptrend, is identified by a series of higher highs and higher lows. Inversely, a market trending lower, or a downtrend, is identified by a series of lower highs and lower lows. Lastly, a sideways, or flat market, is identified by a series of highs and lows moving horizontally across the chart.
The majority of the chart patterns have direct correlations to the trend’s direction. The trend is the backbone of technical analysis. It is a key component of a wide range of trade entry and exit strategies.
The trend is your friend
Support and resistance play an important role in determining the direction of the underlying trend and can also be used as a leading indicator of a change in trend. Let’s take a quick look at uptrends as an example.
As stated above, an uptrend is characterized by price moving upwards in a series of higher highs and higher lows. For the uptrend to continue, a pullback should not move lower than the previous support level, and the subsequent rally must move higher than the previous resistance level.
A pullback that moves lower than the previous support level is an early warning sign of a possible shift in trader sentiment. If the price then fails to take out the previous high before meeting more resistance, then the red flags will start flying, and traders will begin looking for a change in trend.
The same concept applies to downtrends. When a previous support level holds, and a previous resistance level is breached, the market fails to make lower lows and lower highs, and a shift in trend must be considered.
Another key point to mention is that trends rarely change directly from up to down or down to up. If a healthy new trend is forming, the market will spend some time in consolidation or a sideways trend before making a new directional shift.
Do their roles reverse?
In a perfect world, support will become resistance, and resistance will become support once the levels are violated. A popular belief among traders is that a prior resistance level being breached indicates that sellers have failed to protect that level from buyers, and a shift in balance is taking place.
These levels are considered to hold a great deal of psychological significance for traders. And because buyers fought so hard to overtake a level from sellers, they will, in turn, protect it with the same strength in the event a retest of the level occurs. It is at this point where resistance theoretically has turned into support.
Unfortunately, we don’t live in a perfect world, and most of the time, a resistance area becomes another former area of congestion. However, if the market recently spent a lot of time jockeying back-and-forth at that level and volume was on the heavy side, then it’s possible traders will hold it as a psychological level of support if the area is retested within a certain time frame and try to protect it.
So, while resistance can become support, it is not an indisputable truth. The reality is, we never know if it really is a new support level until after the fact. The same holds for new resistance levels. There’s no guarantee that a former support area will become a future resistance area.
Again, watch for extreme volume, how long the market spent at the congestion area, and how recently it happened to gauge the level’s probability possibly holding as resistance. Let the market do its thing, don’t try to fight it.
What are key market price levels?
Most futures traders use price levels as an integral part of their trading. There is some process of analysis to define price levels before trading, and often price levels will also show themselves as the trading day progresses. Traders can set their support and resistance levels by using an indicator, pivot points, previous support or resistance, volume profiling, or many hundreds of other approaches. Setting a price level is just a traders’ way of saying, “I expect something to happen at this market price.” It gives them an anchor on which to place a trade.
Trading breakouts and reversals at key market support and resistance levels
Most commonly, traders are looking for either a market reversal or a breakout at key support and resistance price levels. So what would make either of those two things happen?
Reversals at price support and resistance levels can occur for several reasons:
- It may be that the price is a target for many traders. Consider a market that was moving up to a point where lots of traders had exit orders. Long positions exit their trades by selling, which can either halt the move up temporarily or have price move down, which other traders see and trade with.
- Price moves up until we get to the point where nobody wants to buy at what are now considered to be extremely high prices. With a lack of buyers, the market will stall and is often enough to cause an imbalance favoring the sell-side.
- Sometimes it's just lots of sellers waiting to initiate new market short positions at what they consider to be priced too high for the market to bear.
With market reversals, you have both an “initial cause” as well as the more herd-like follow-up reaction to the initial move.
We can consider market breakouts as follow:
- A breakout in a trending market will occur because nothing changes. We just continued through a price level. Trader behavior remained consistent. In a breakout to the upside, it means buyers keep buying.
- In a range-bound market, a breakout usually starts with a probe through the top of the range, which triggers stop-loss orders that in themselves perpetuate the breakout.
In one of the above cases, the “lack of new market buyers” in a move up, the expected move occurs by a relative lack of activity. In another, a breakout occurs because nothing changed at all. In other cases, you are only going to get the change in price that you need if other traders make an active decision to exit their positions or enter new ones at that specific level.
Some trades will work because nothing changes, and some will work because there is a major change in behavior.
Be aware of stop order market levels
With a breakout of a range, traders have stop orders to consider. Stop orders getting triggered cause a swift and violent reaction, and so the payback will be fast IF you are right about the trade. If we are moving to a key price level we last touched three months ago, will there be as many stop orders on the other side of that level compared to a level we last hit 3 hours ago? Most likely not. The age of the market price level is also a factor.
Not all support and resistance market levels are equal
For those new to trading, these may be things you’ve never considered. Not all support and resistance levels are equal. Any specific trade doesn’t just require the price to move your way, but requires a specific set of behavior from fellow traders.
Monitor key price levels that the herd of traders follow
A trade that requires a significant change in market participants’ behavior requires lots of people to react at that price. That can only happen if lots of people are looking at the same price or the same area. Many novice traders start out trying to find a magical combination of indicators that gives them a trigger to trade, trying different indicator settings to find that ‘special’ combination that tells them when to buy and sell. The irony is –the more you combine and customize, the more unique the results become. The more unique the results, the less likely it is that other traders will be looking at the same level, and the less likely there will be any reaction.
Downside to obvious trading levels
Of course, there is a downside to obvious levels. Predatory traders will watch these levels too. A “head-fake” is a common term given to a market that appears to breakout but then falls back into the range. Consider what is going on there:
- We move up to a level of resistance – reversal traders have their entries there.
- We push through the level of resistance – reversal traders get stopped out, breakout traders enter the market.
- We then drop back through the level, breakout traders get stopped out.
This is a “bread and butter” trade for predatory traders. The conundrum is that for many trades, we need other people to change their behavior. That means we need our area to be reasonably well-known. We also know that these well-known areas are likely to be gamed by predatory traders.
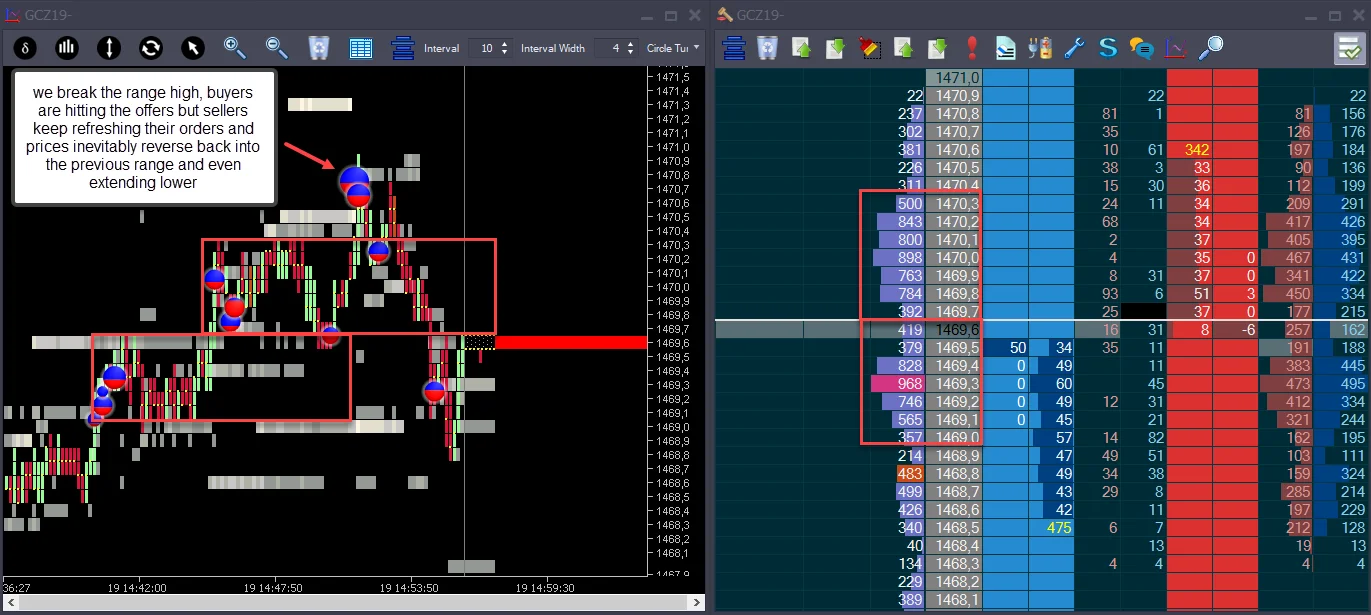
Figure 1 – Reversal traders getting stopped out. Breakout out traders entering the market. Prices reverse back down with breakout traders being stopped out.
Nobody said trading is easy!
It is without a doubt that the most attractive trades to novice traders are reversal trades. Many aspiring traders have a vision of buying at the low of a move and selling at the high, chasing the biggest paying trades. The reality is that with any move – you can have 3 or 4 good candidates for the low of the move and as many for the high of resulting counter-move. By the time you have had three failed attempts at catching one of these extremes, you will be playing catch-up and be lucky to break-even as a result of your hard work. There are lots of vendors out there selling “secret” systems for catching these high/low trades, but as we have seen, it will take more than a “secret” to turn the market.
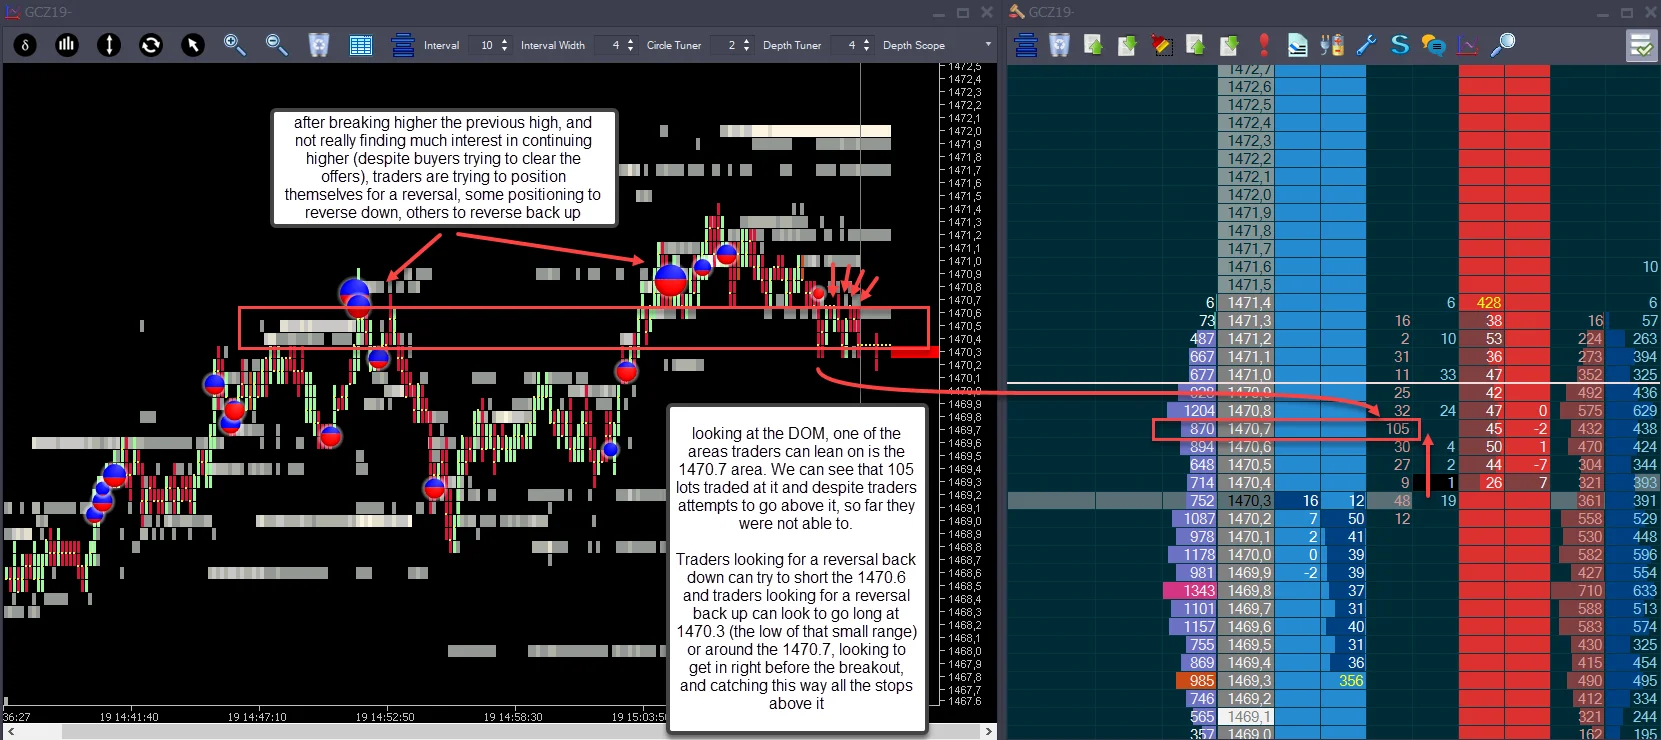
Figure 2 – Traders can lean on a price, positioning themselves for a reversal. It will give them a clear area of movement.
The middle ground
It would be somewhat unfair to throw problems at you without solutions. The first step in resolving an issue is realizing that it exists. Understand that a full reversal is not possible at a price if only you and two other guys know about the level. Sure, you will get lucky sometimes. Overall, you will lose if you continually trade against the majority of traders unless you are doing so in areas where many people are looking to change their behavior.
Let’s say you have 3 or 4 candidates for the low of a move or the end of a trend. Price is moving down, and you aren’t in a position. Why not let other traders do all the heavy lifting? Why not let the market move down and find the level to reverse off and then take a trade to the long side? Your checklist for entering a trade to the long side could be something like this:
- The market moved down to your levels
- The market reversed at or close to one of your levels
- You see a decent-sized price swing-up with good volume in the reversal off that level
- Now start looking for a long trade
With this approach, you are still using the key trade levels, just in a slightly different way. You are letting other traders get in early and suffer the fake reversals caused by predatory traders. You can see the market has reversed, and that traders in the last “push down” have been stopped out. Now you can make an educated decision as to whether trader behavior did change as expected at your level. You have both anticipated and seen the reaction at one of your key trade levels. Now, traders’ behavior has changed; it is still early in the move, and there is still good potential in the new direction. Any trades you take in this direction are based on trader behavior continuing. You are no longer bucking the trend, no longer taking bets against the herd.
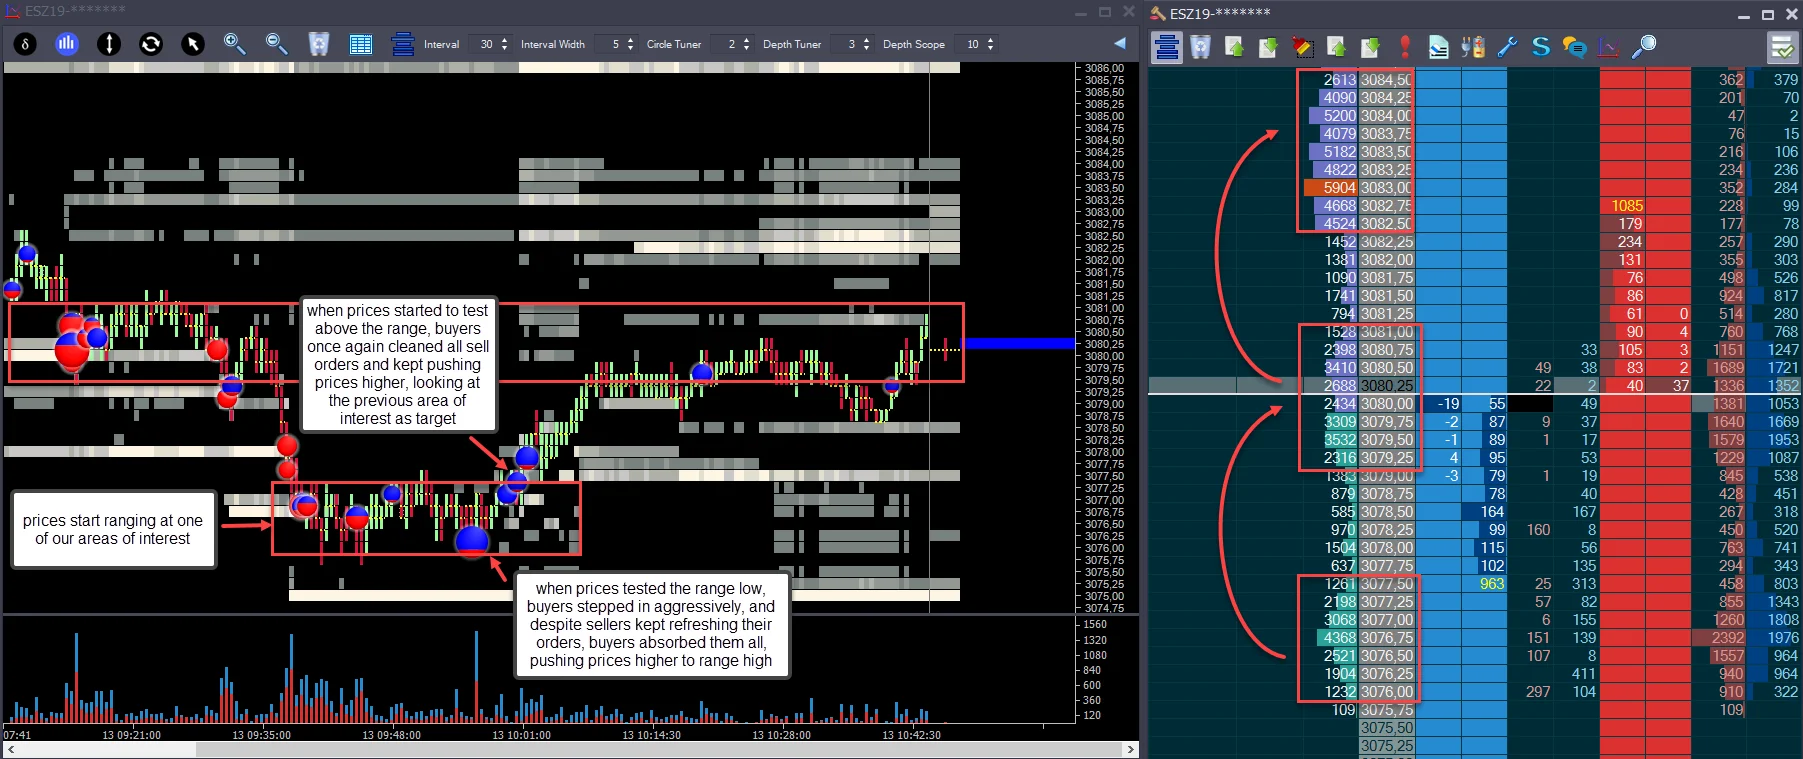
Figure 3 – Traders were waiting for someone else to step in first. Looking to have a better view of who is in control, from where an imbalance could come from, and then act accordingly.
Of course, you cannot catch the whole of the move this way, but if you are trading reversals right now and suffering from the high number of losses associated with trying to guess the end of a move, this is a great middle-ground.