
Introduction to triangle patterns
The purpose of this guide is to educate traders on the basic techniques and principles of technical analysis, specifically triangle chart patterns. For some traders, this may be familiar territory. For others, it provides a solid foundation for understanding how price consolidates and breaks out on a chart.
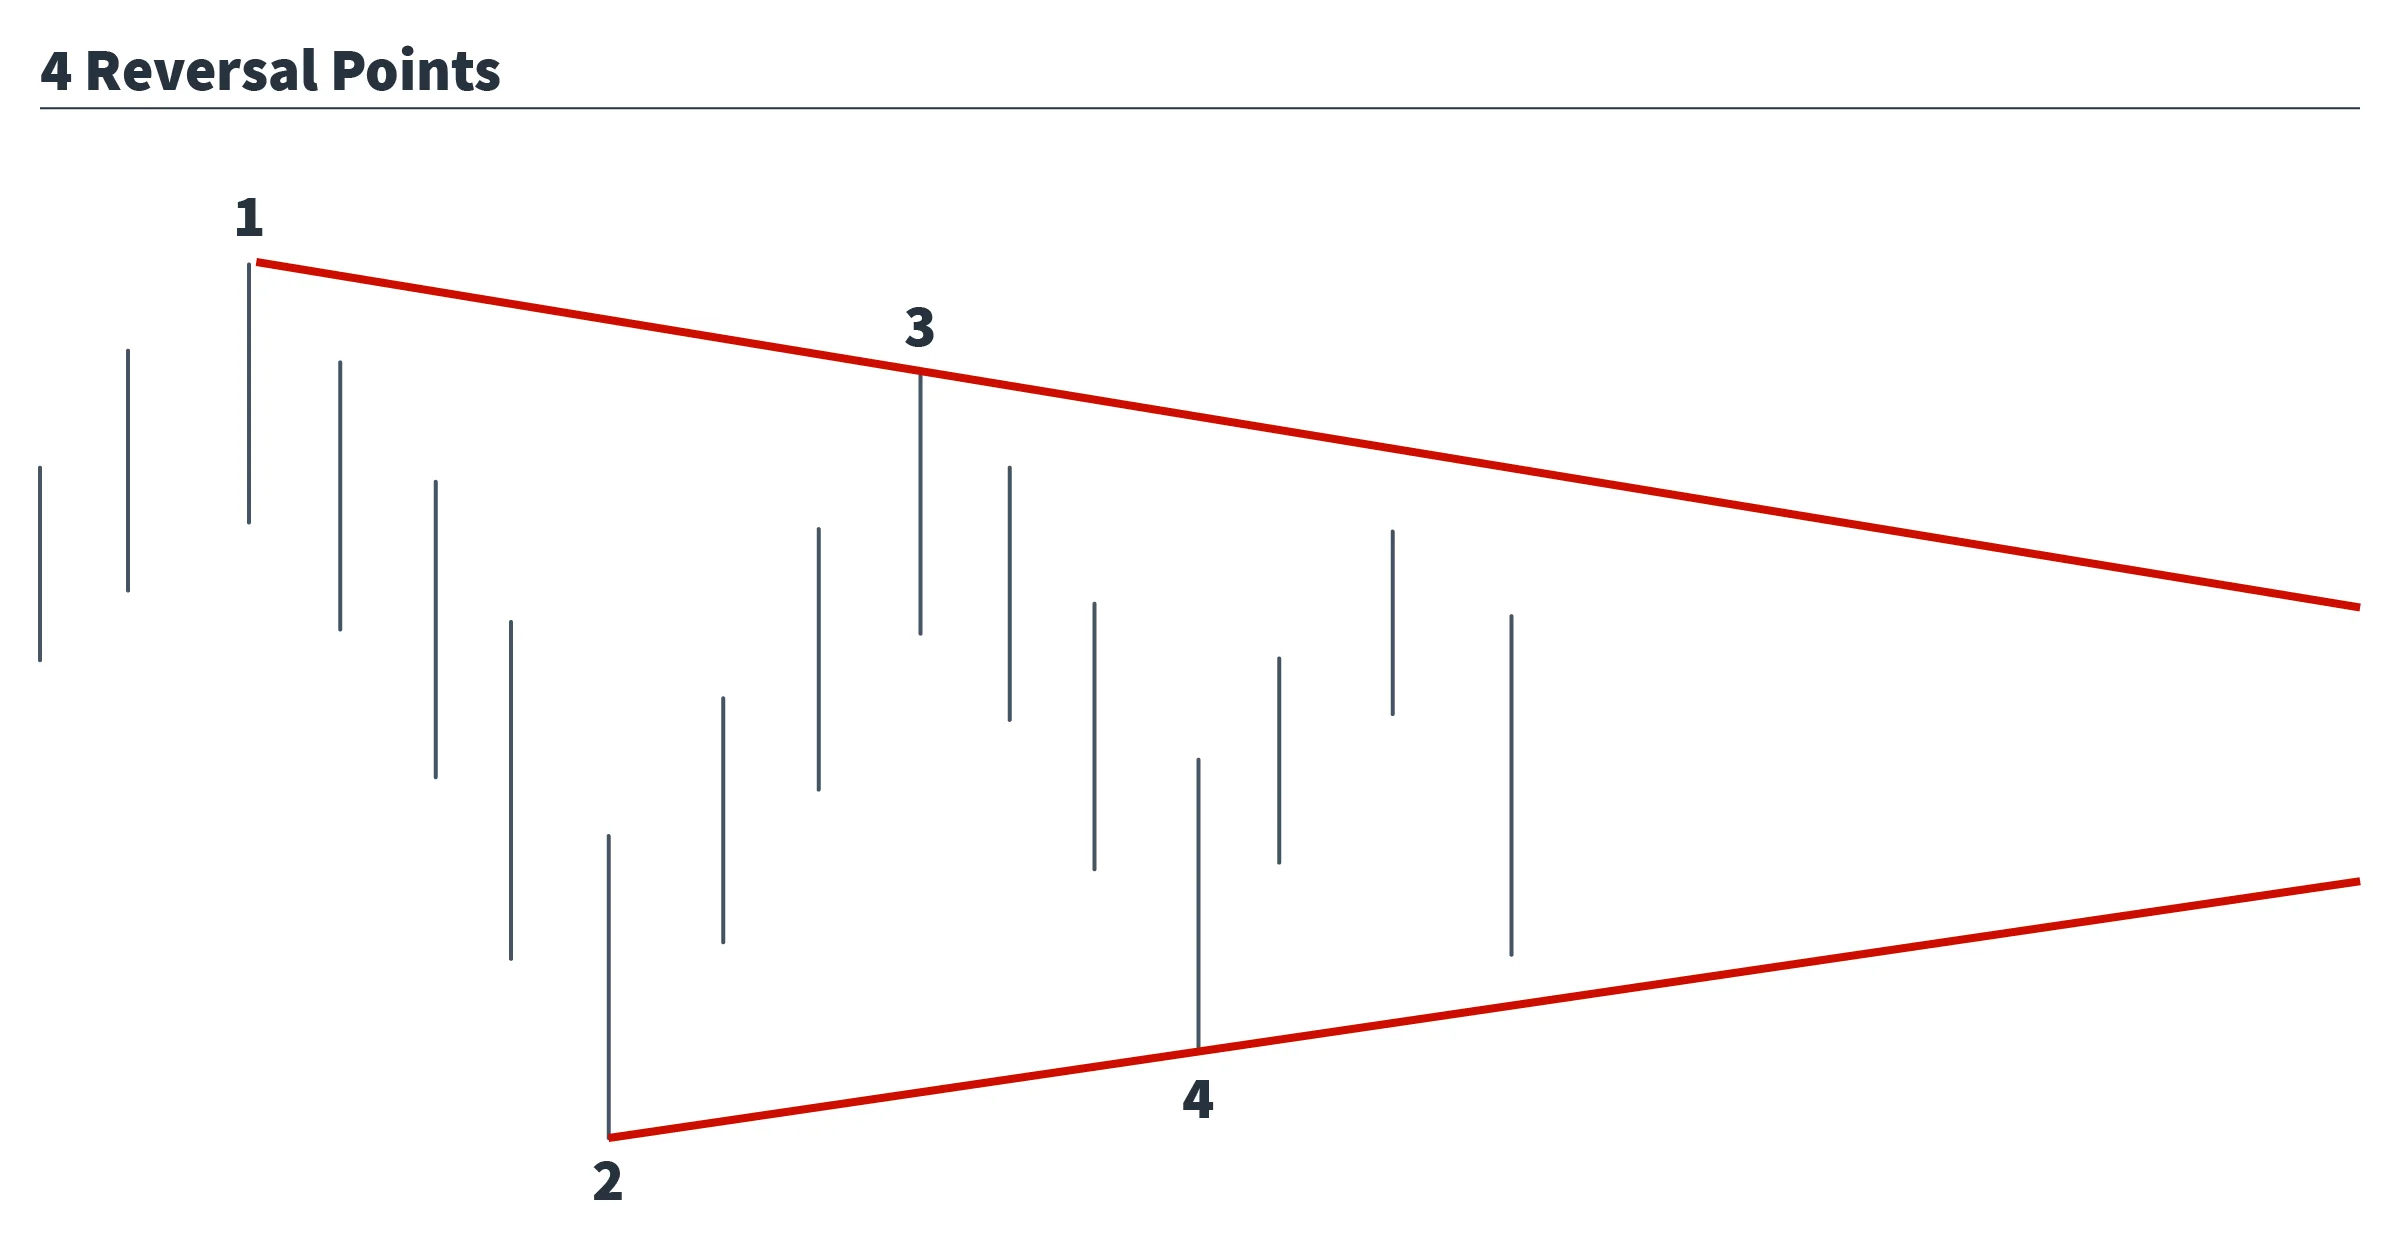
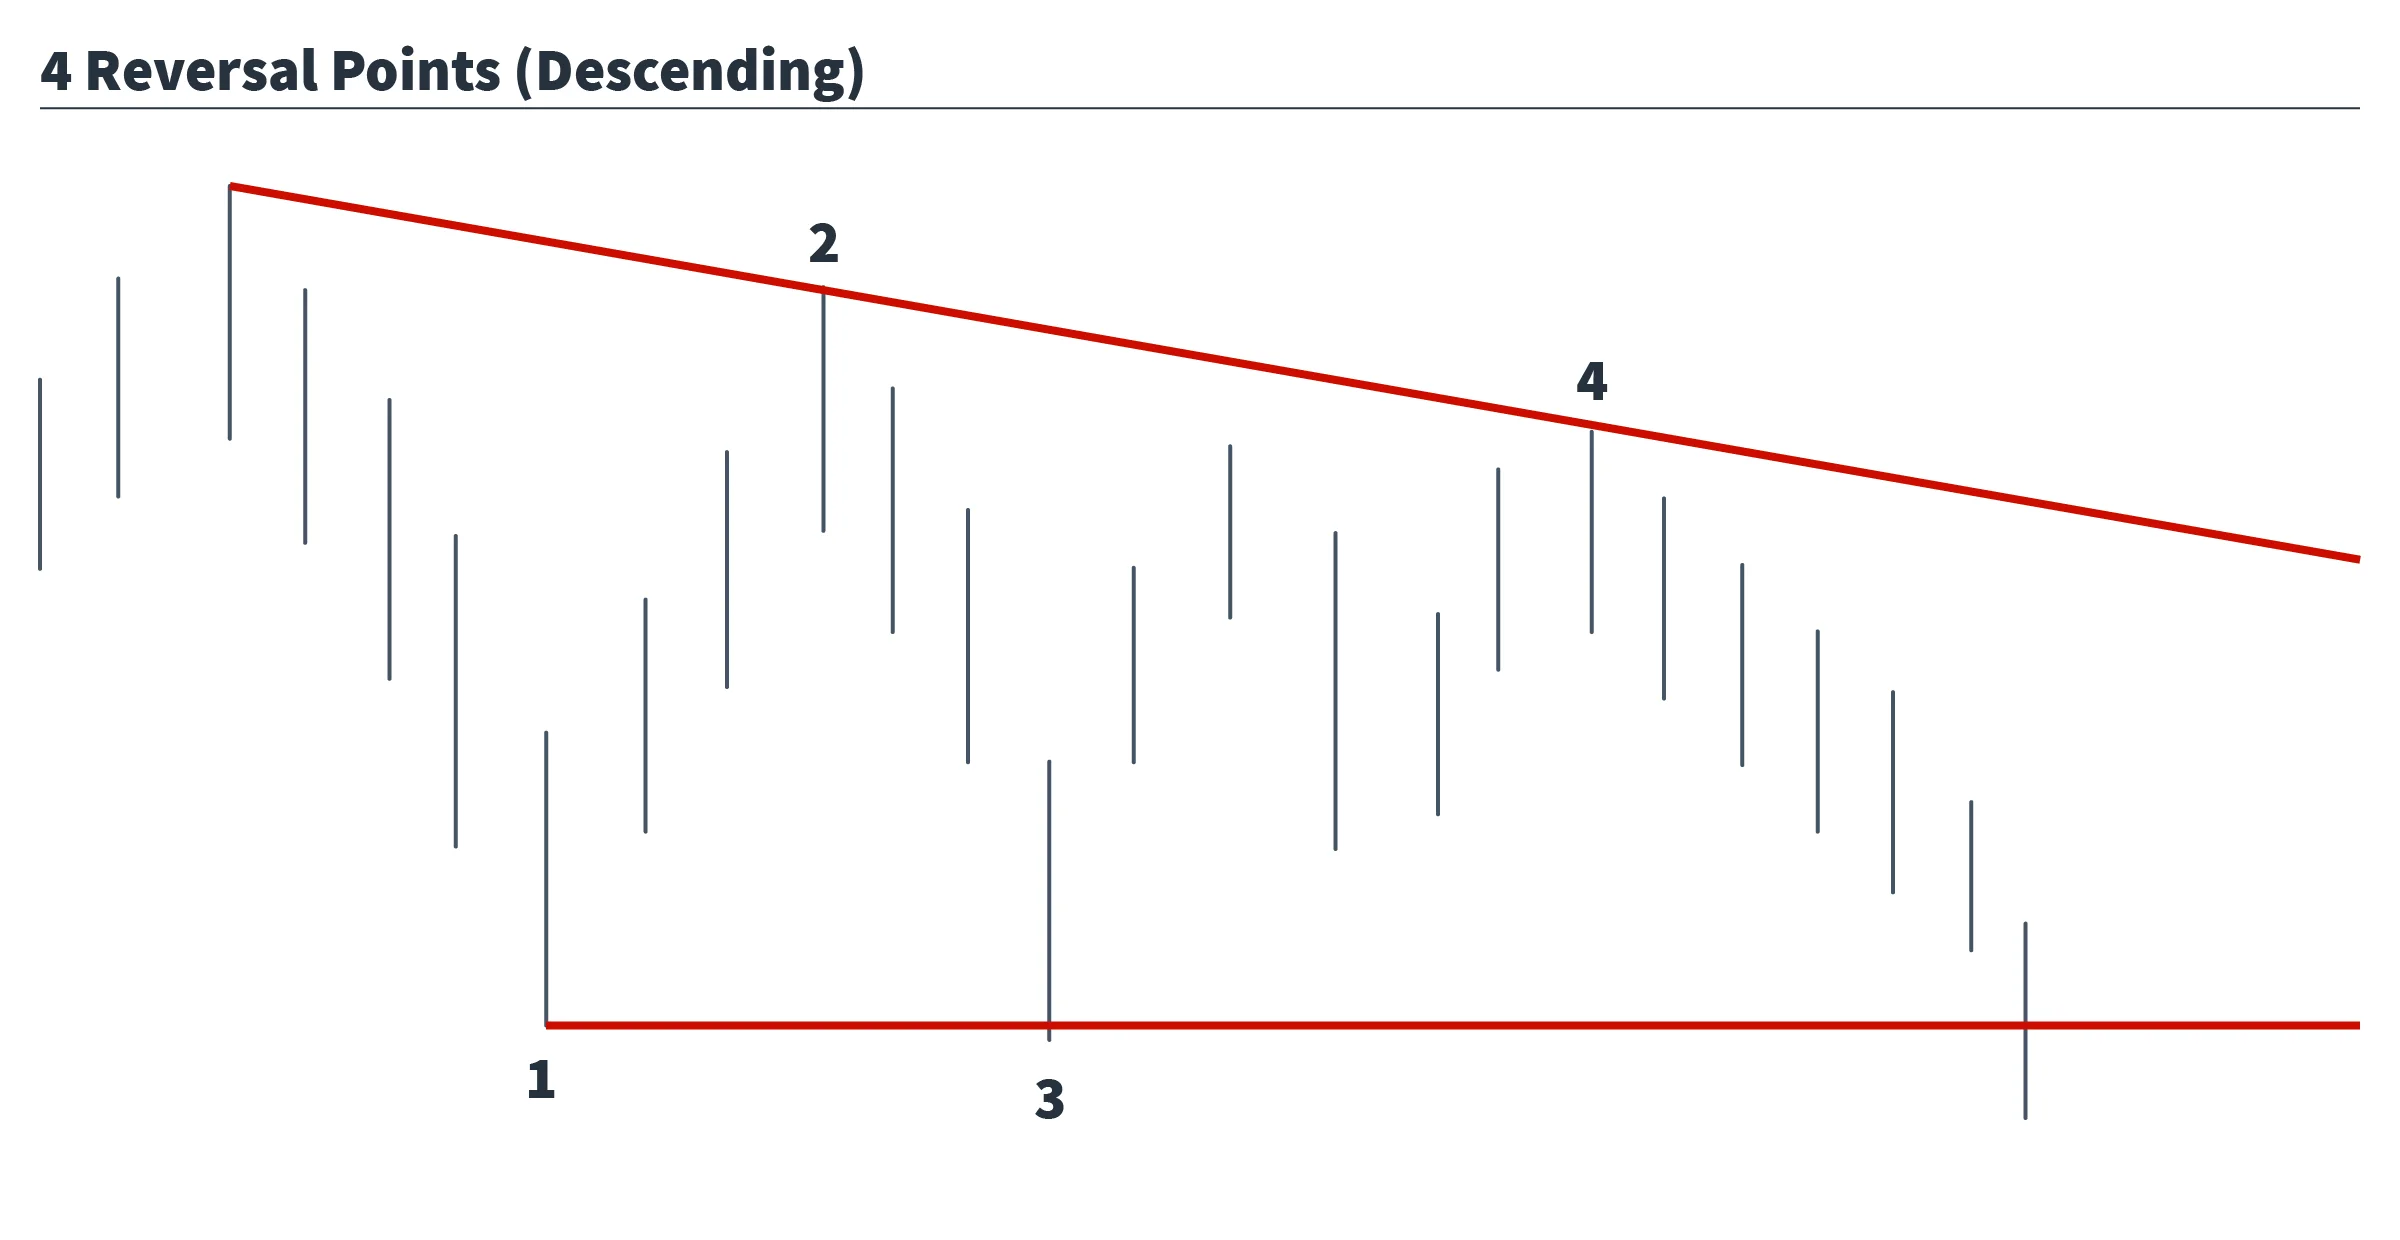
In the world of technical analysis, there are 4 major triangle patterns that can signal either trend continuation or trend reversal after a period of consolidation: symmetrical, descending, ascending, and expanding. These patterns consist of 2 diverging trend lines and must contain a minimum of 4 reversal points in order to be considered a triangle.
Symmetrical triangles
Symmetrical triangles are usually considered a continuation pattern, and consist of a series of lower highs and higher lows, with upper and lower trend lines converging towards an apex. You should expect to see a drop in volume as price moves toward the apex, further signalling the likelihood of a breakout, followed by a sharp increase in volume once the breakout occurs.
Charting purists will insist that the breakout must occur somewhere between the ½ to ¾ mark of the horizontal width of the triangle, but in practice, you will find this is not always the case. In the era of predator algos and HFT programs, false breakout signals are more frequent than ever, so risk should be managed accordingly.
Profit target
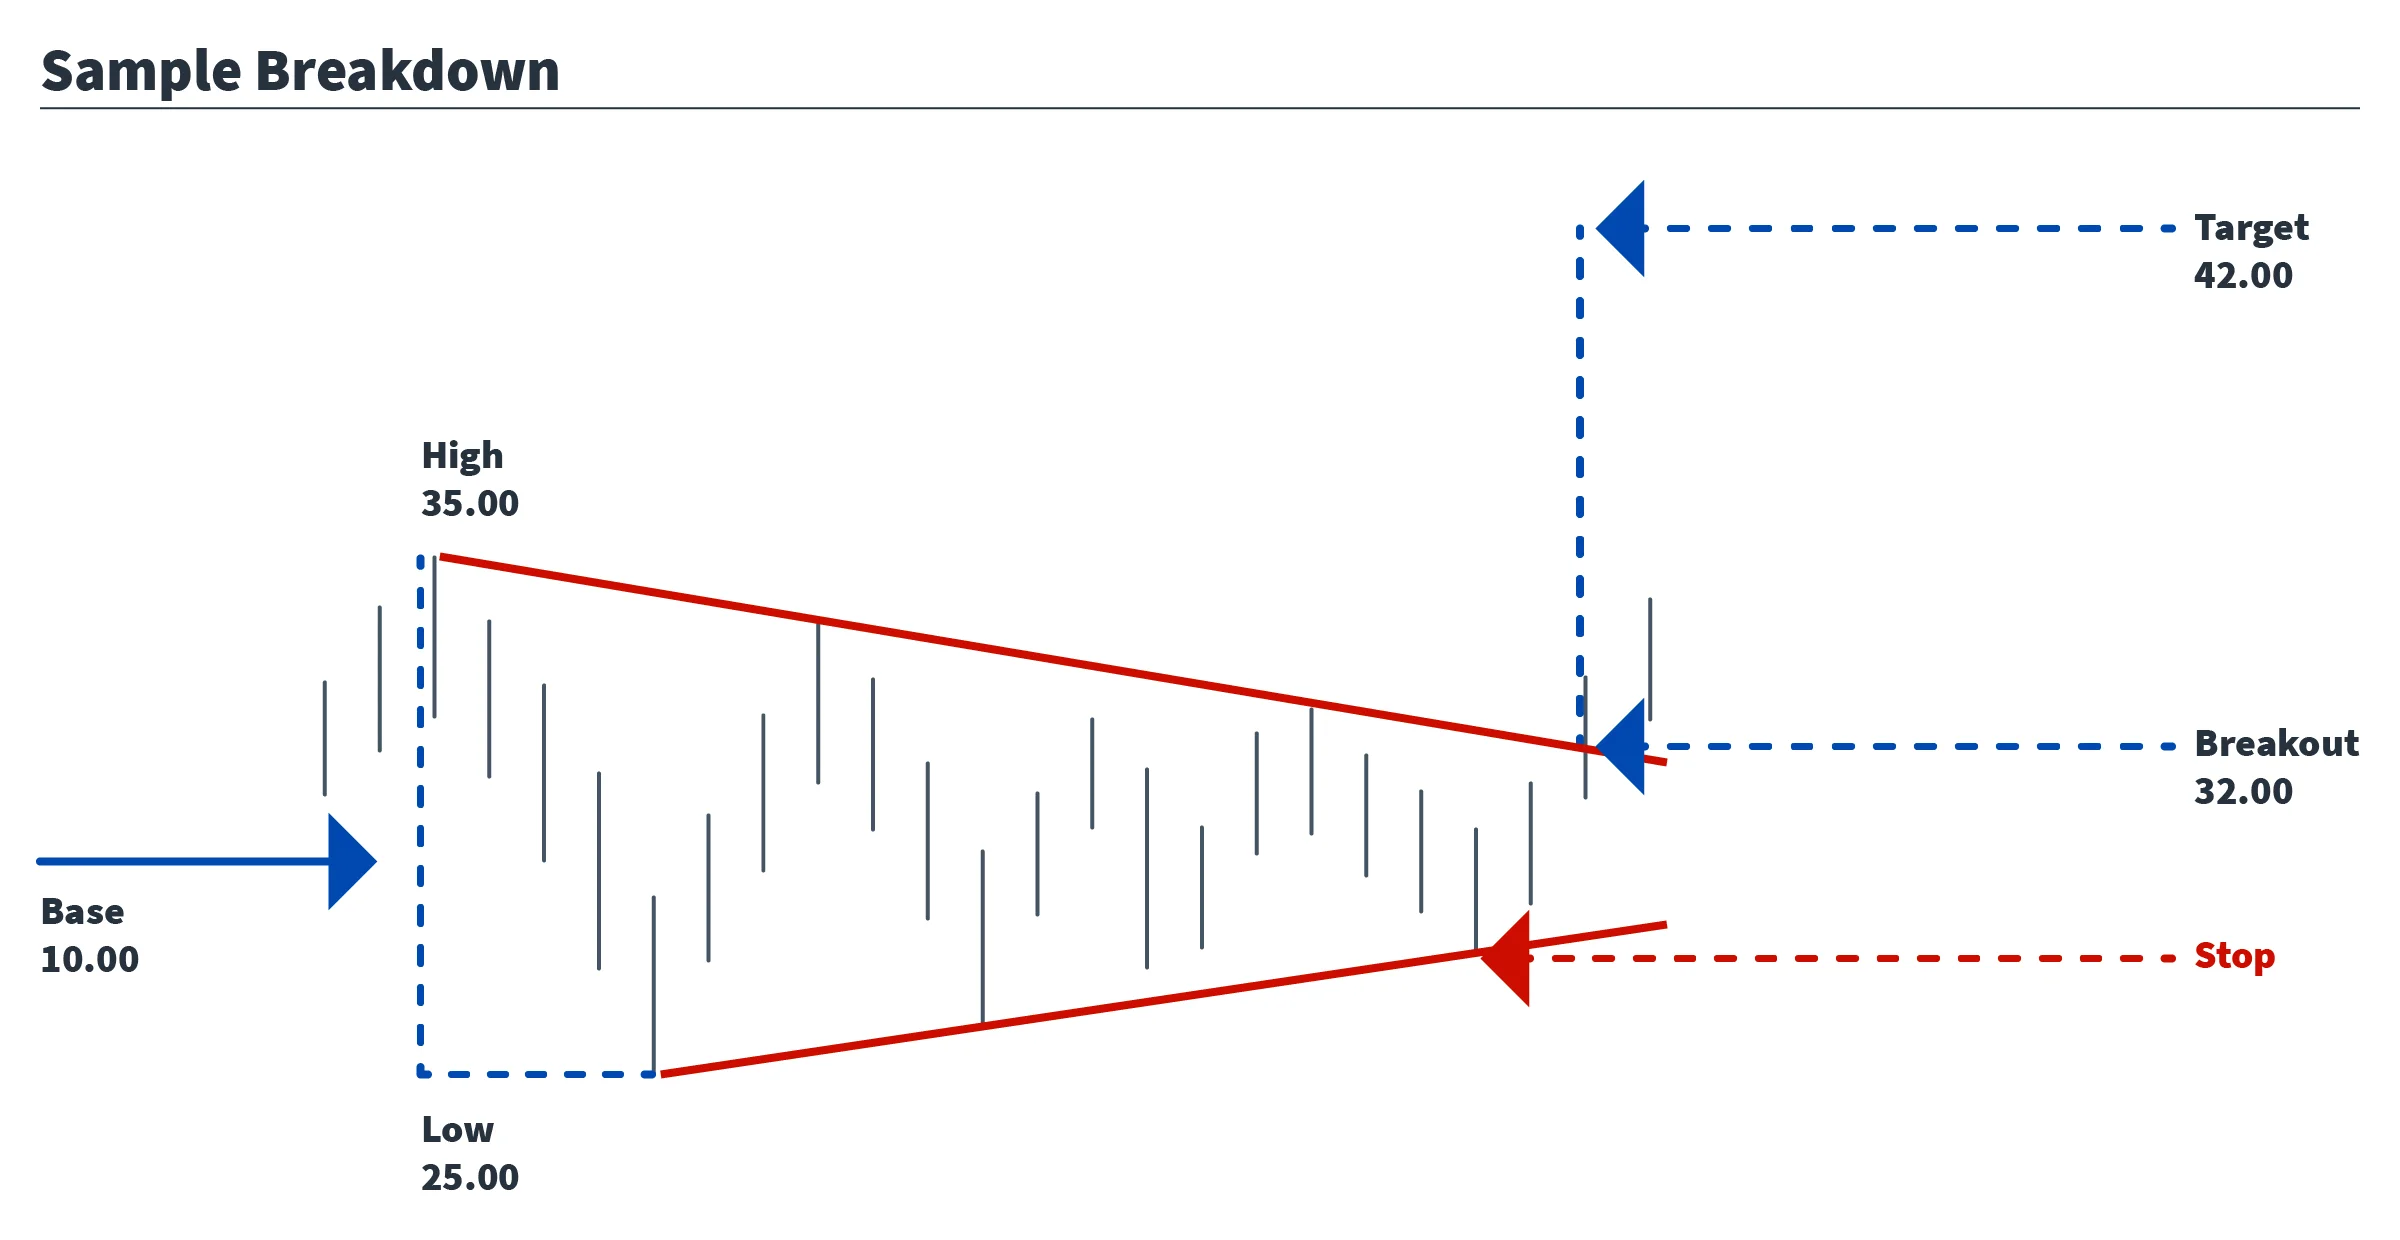
The profit target should be equal to the highest and lowest points at the base of the triangle measured from the breakout price. For example, say the market you are trading is trending higher when the market begins to move sideways. Once 4 reversals points are plotted, take the difference between the first high and first low, this is then the distance price should be expected to move after the breakout.
So, if a triangle produces a high print of $35.00 and a low print of $25.00, that would give a base value of $10.00. If the breakout price is $32.00, then $42.00 becomes the target.
Stops and risk parameters
Once a price breakout is confirmed, a stop should be placed below the previous low before the breakout. Again, chart purists will say the stop should be placed just below the breakout level, but the market does sometimes have a tendency to retest the breakout level and hunt for stops (predator algos).
Risk parameters can, and probably should, be adjusted throughout the duration of the trade. For example, once price has passed the 50% mark heading towards the profit target, it’s possible to move your stop up to the break even price. Or, if more than one contract is being traded, you may also begin to scale out of the position at the 50% mark to lock in profits.
Ascending triangle
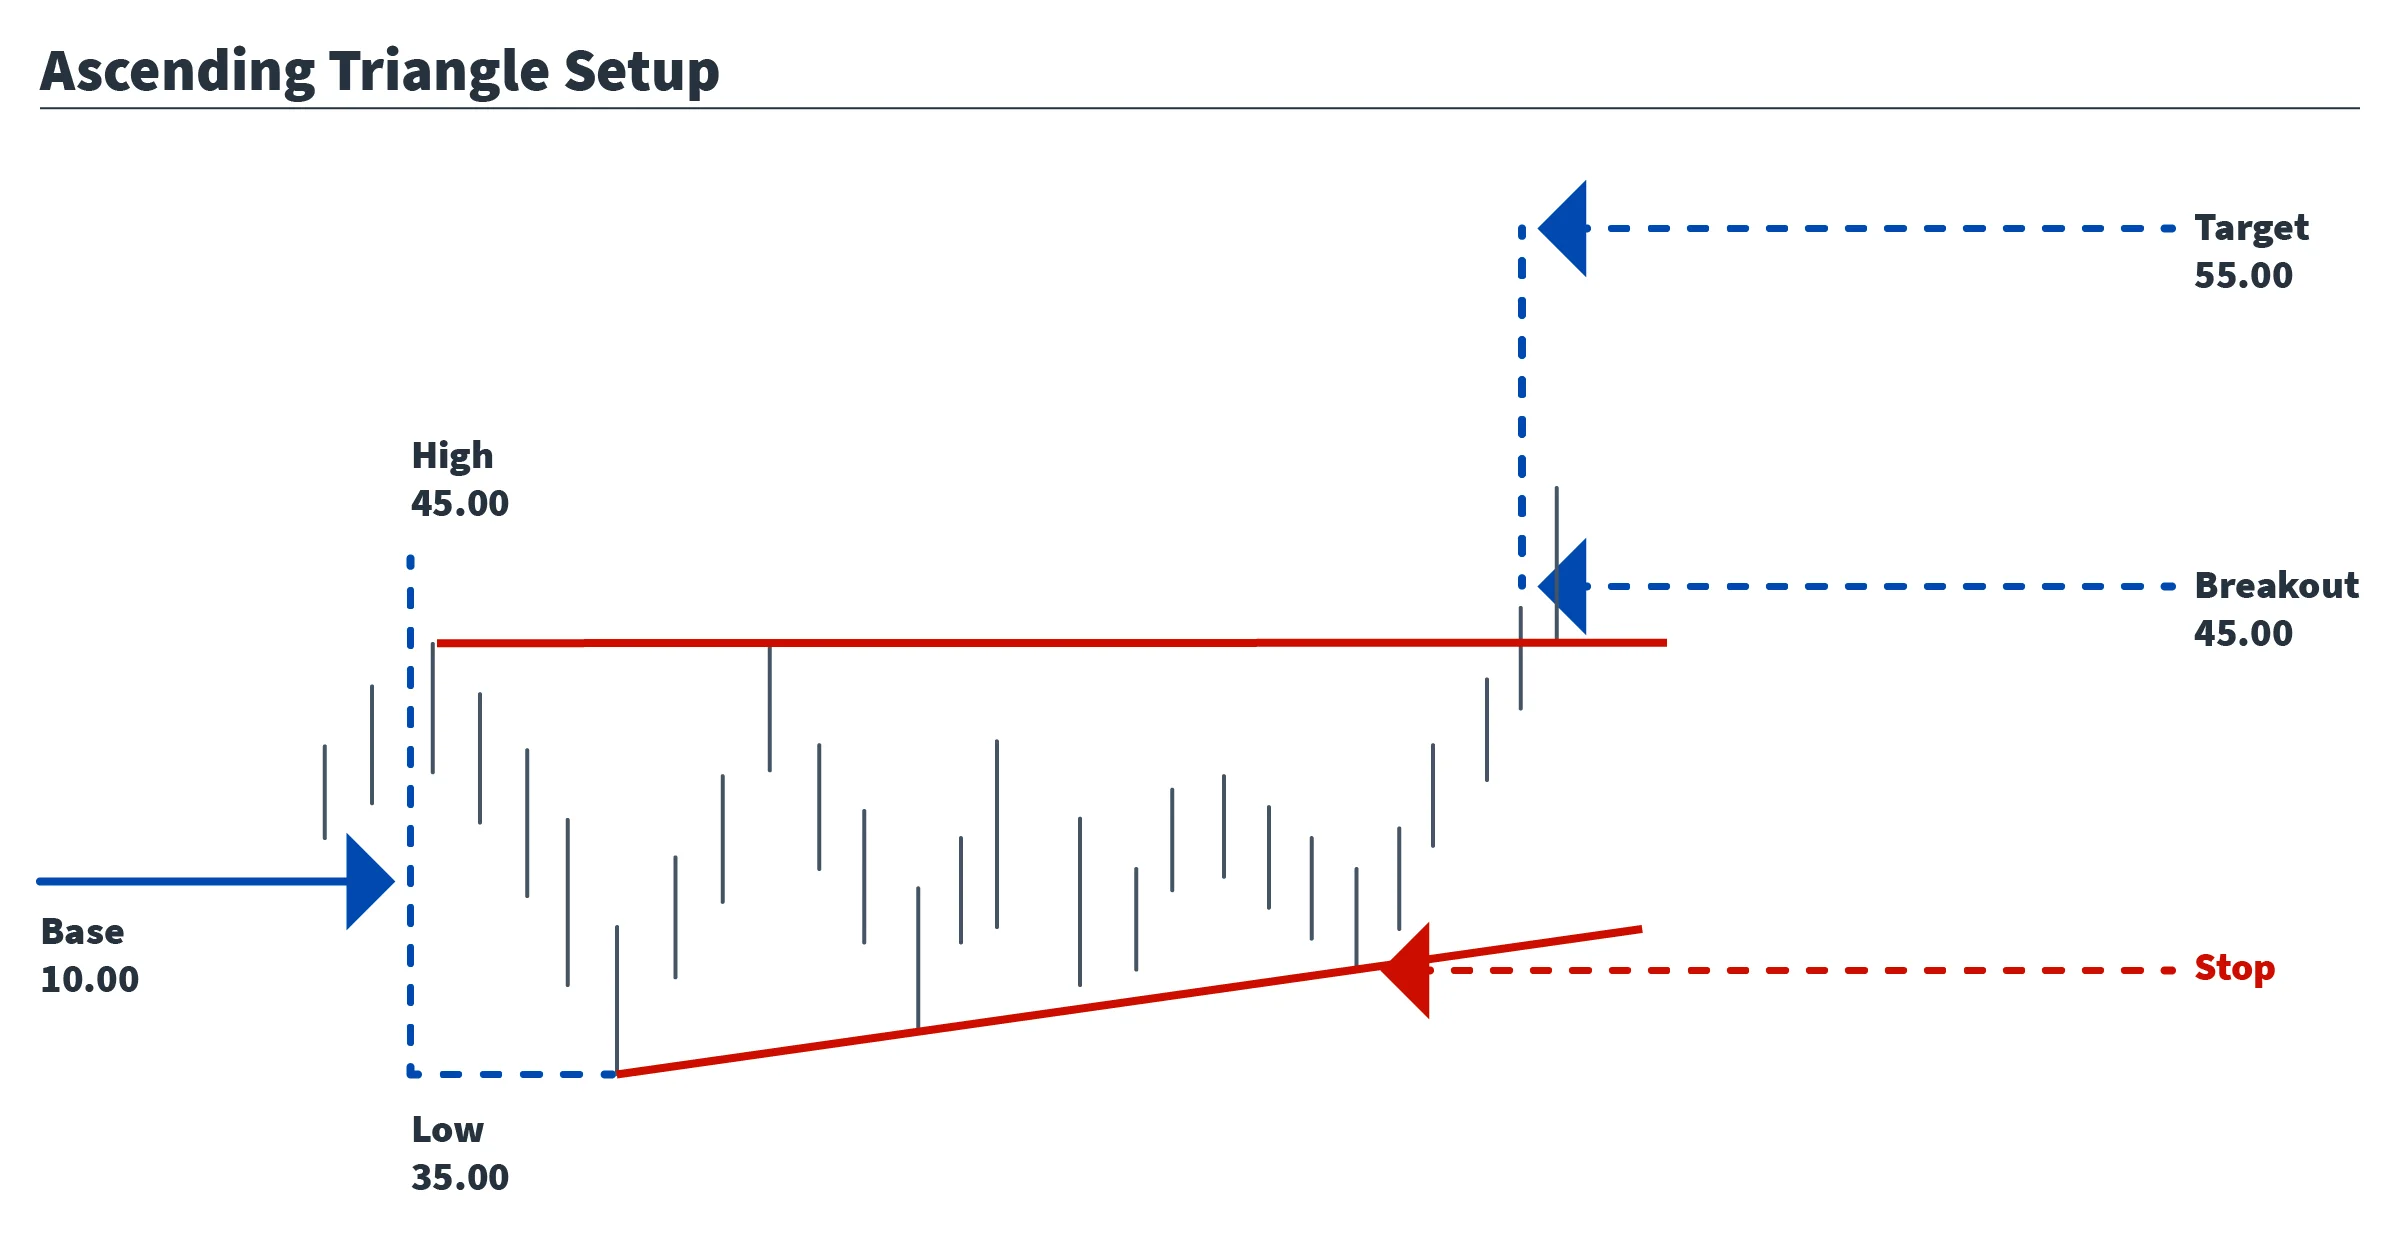
The ascending triangle is a bullish chart pattern consisting of 2 trendlines converging towards an apex. In an ascending triangle, the top line is horizontal, representing a typical resistance area, while the bottom line ascends upwards, showing a series of higher lows. There must be a minimum of 4 reversal points in order for this to be considered a triangle pattern.
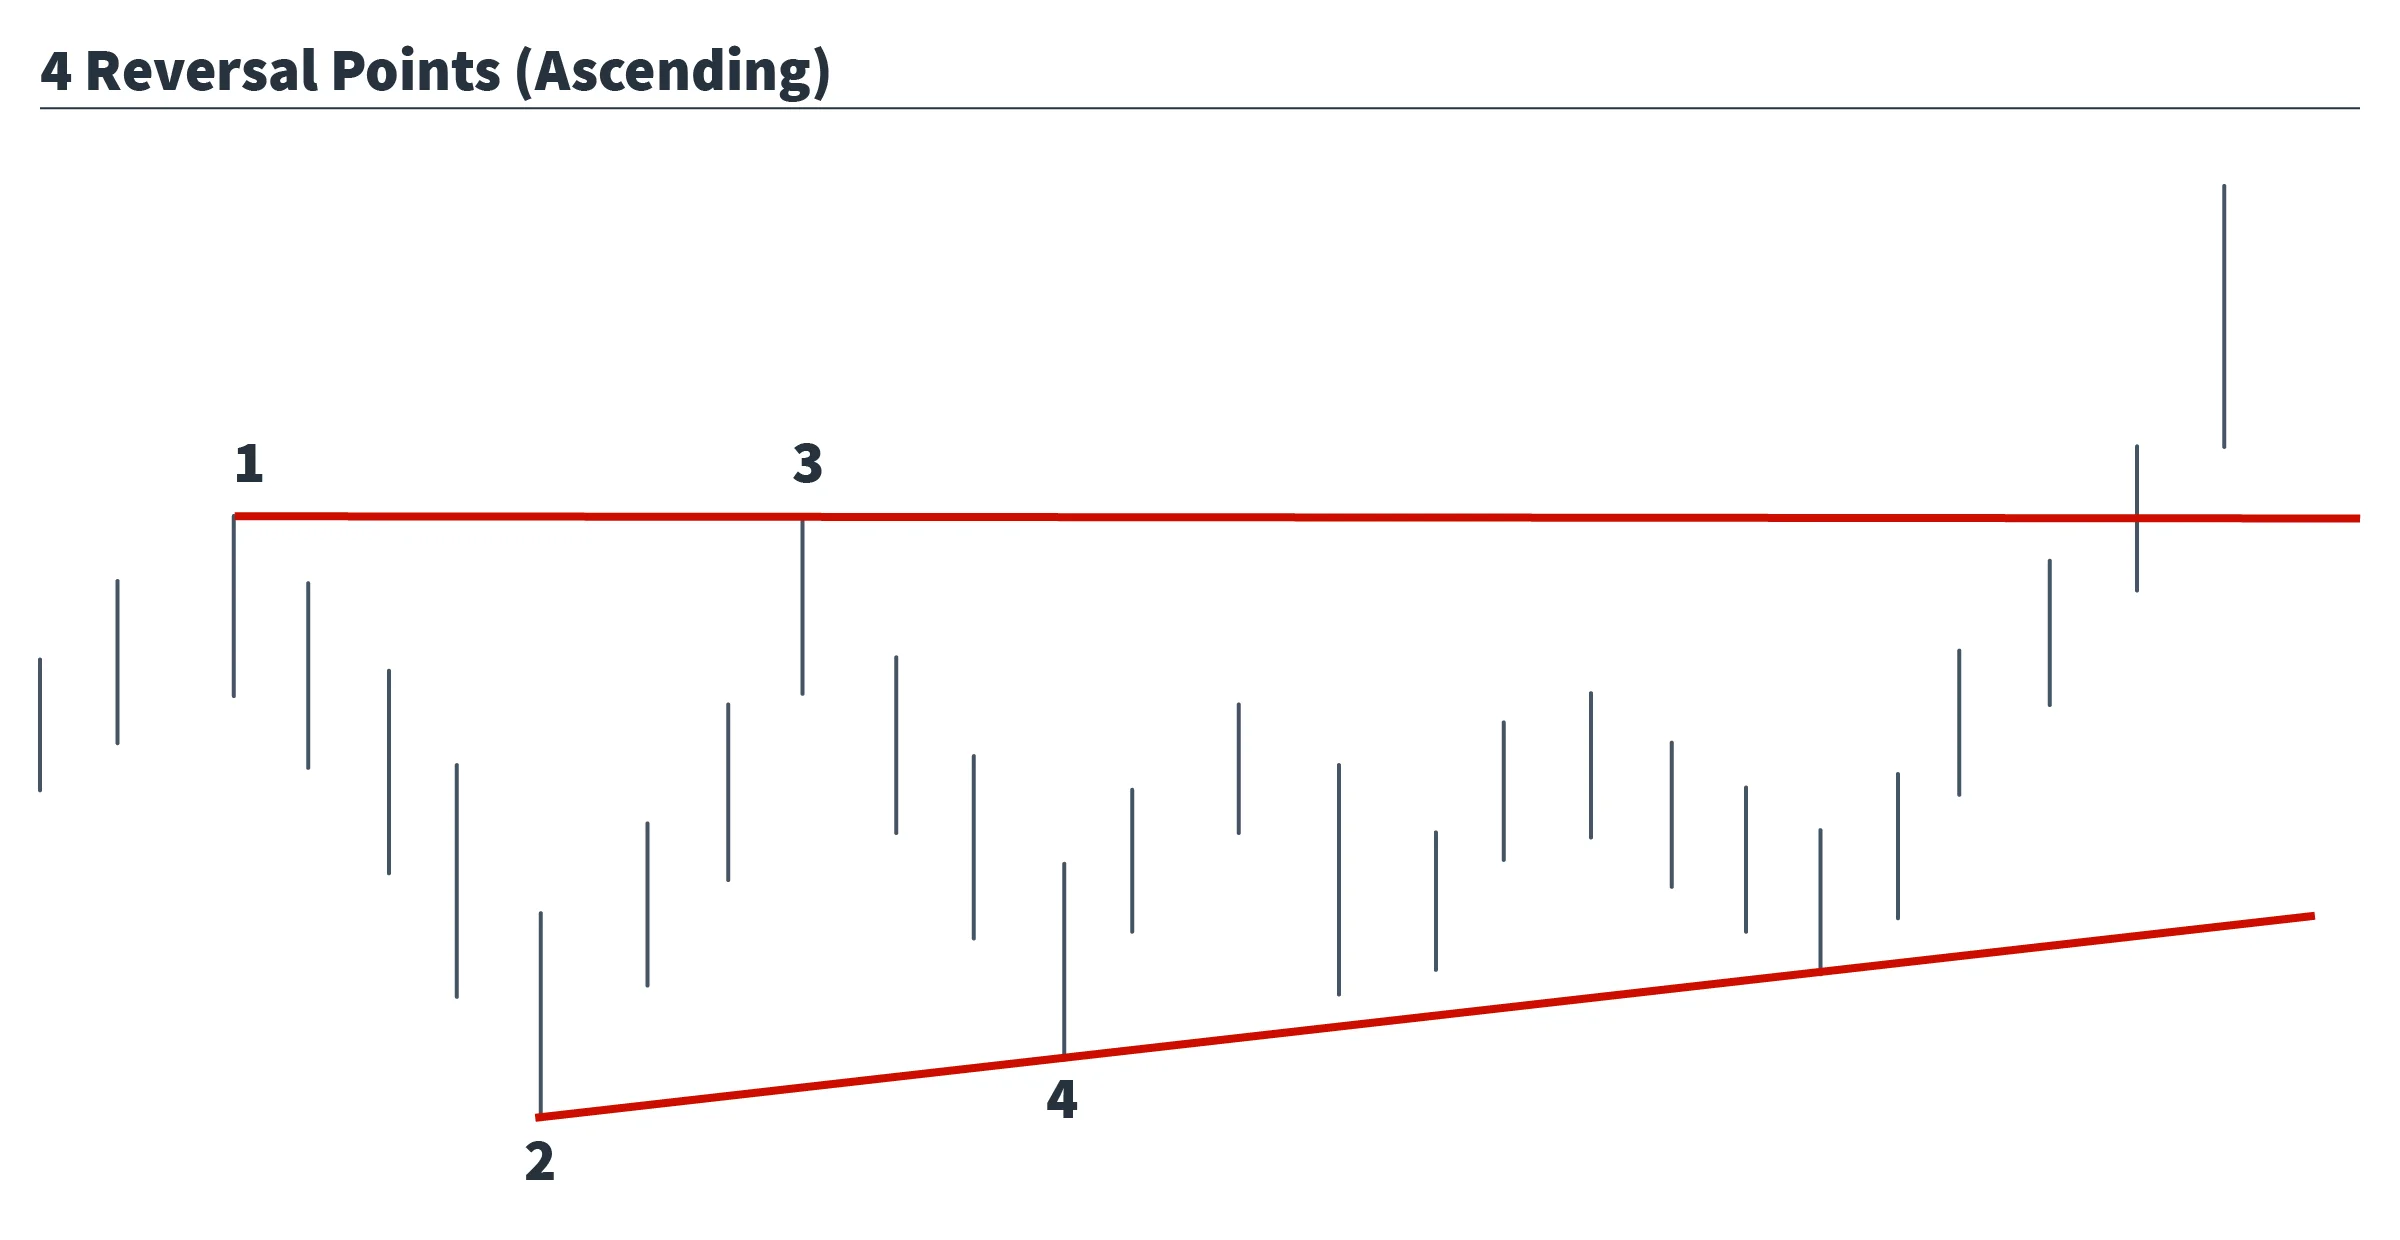
As price begins to consolidate and move towards the apex, the first thing you should notice is a significant decrease in volume as uncertainty increases. A breakout occurs when the resistance level is breached, and confirmed with a price bar closing outside of the triangle on increased volume.
False breakouts are very common with this setup, as weak longs are generally tested with a run at downside stops before the upside breakout is confirmed, so trade entry and proper risk management are also key components.
Profit target
The profit target setup is the same as it is for the symmetrical triangle. Take the distance between the highest and lowest points at the base of the triangle and measure it from the breakout price. So, when the market begins to move sideways, and 4 reversals points have been plotted, take the difference between the high and first low, this is then the distance price should be expected to move after the breakout.
So, if a triangle produces a high print of $45.00 and a low print of $35.00, that would give a base value of $10.00. If the breakout price is $45.00, then $55.00 becomes the target.
Descending triangle
The same principles that applied to ascending triangles also apply to descending triangles; they are simply inverted.
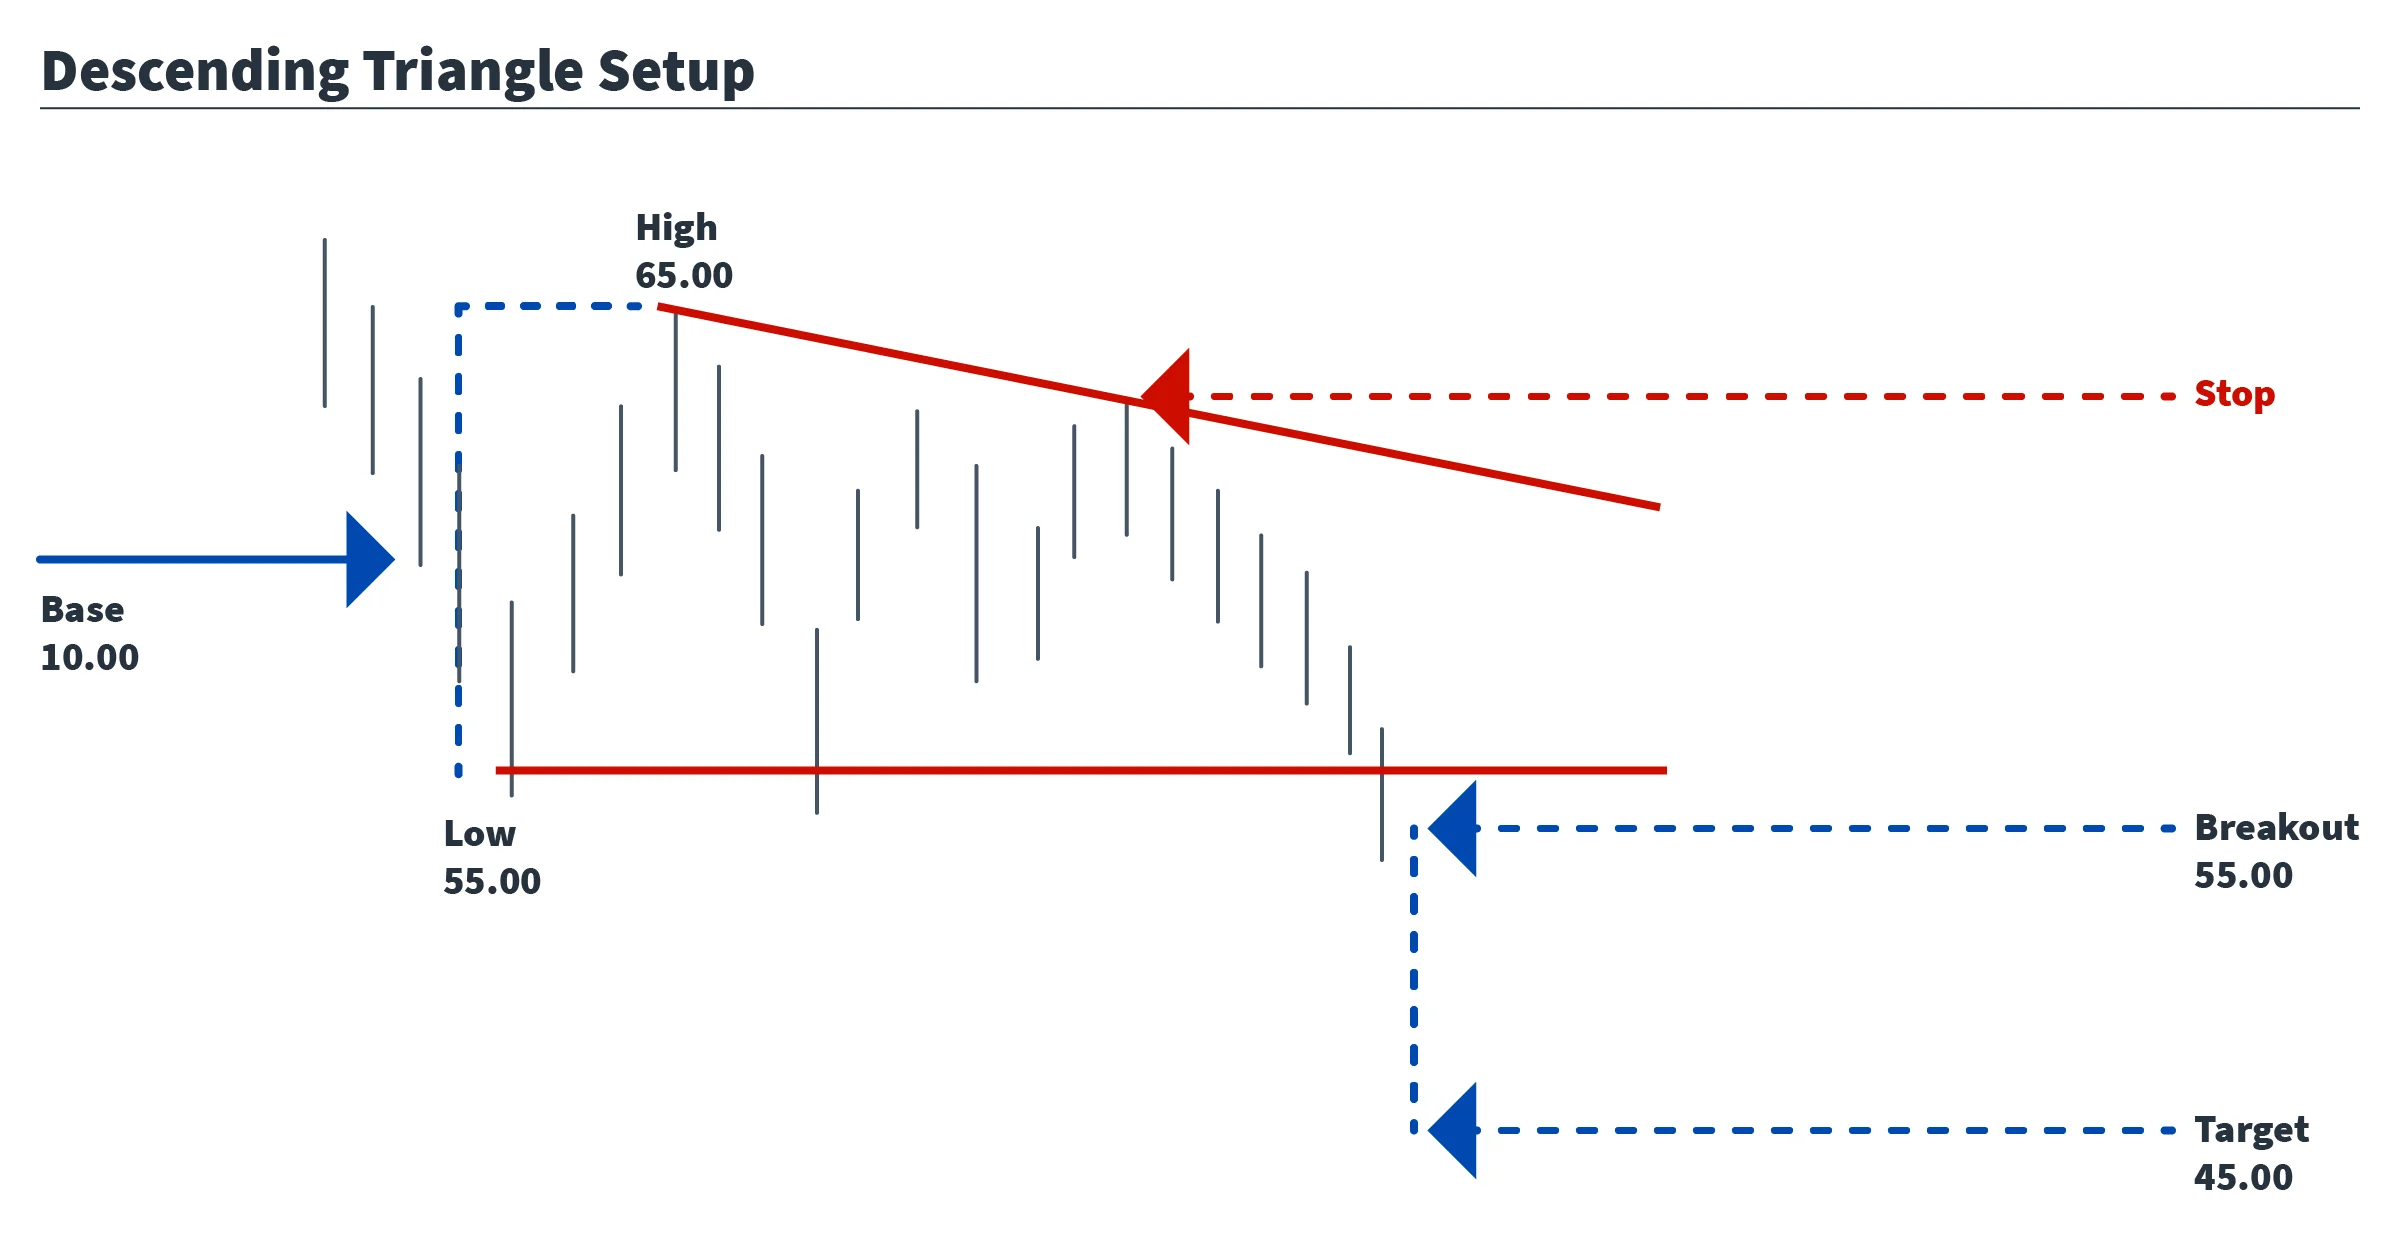
The descending triangle is a bearish chart pattern consisting of 2 trendlines converging towards an apex. In a descending triangle, the bottom line is horizontal, representing a typical support area, while the top line descends downwards, showing a series of lower highs. There must be a minimum of 4 reversal points in order for this to be considered a triangle pattern.
As price begins to consolidate, you should again expect to see a drop in volume. A breakout occurs when the support level is breached and confirmed with a price bar closing outside of the triangle on increased volume.
False breakouts are also very common with this setup. Weak shorts are often tested with a run at upside stops before the downside breakout is confirmed.
Profit Target
The profit target setup is the same as it is for the ascending triangle. Take the distance between the lowest and highest points at the base of the triangle, then measure it from the breakout price.
When the market begins to consolidate, and 4 reversals points have been made, take the difference between the low and first high; this is then the distance price should be expected to move after the breakout.
So, if a triangle produces a low print of $55.00 and a high print of $65.00, that would give a base value of $10.00. If the breakout price is $55.00, then $45.00 becomes the target.
Stops can be adjusted based on your entry price for this setup, but should never fall below the 2:1 risk/reward ratio.
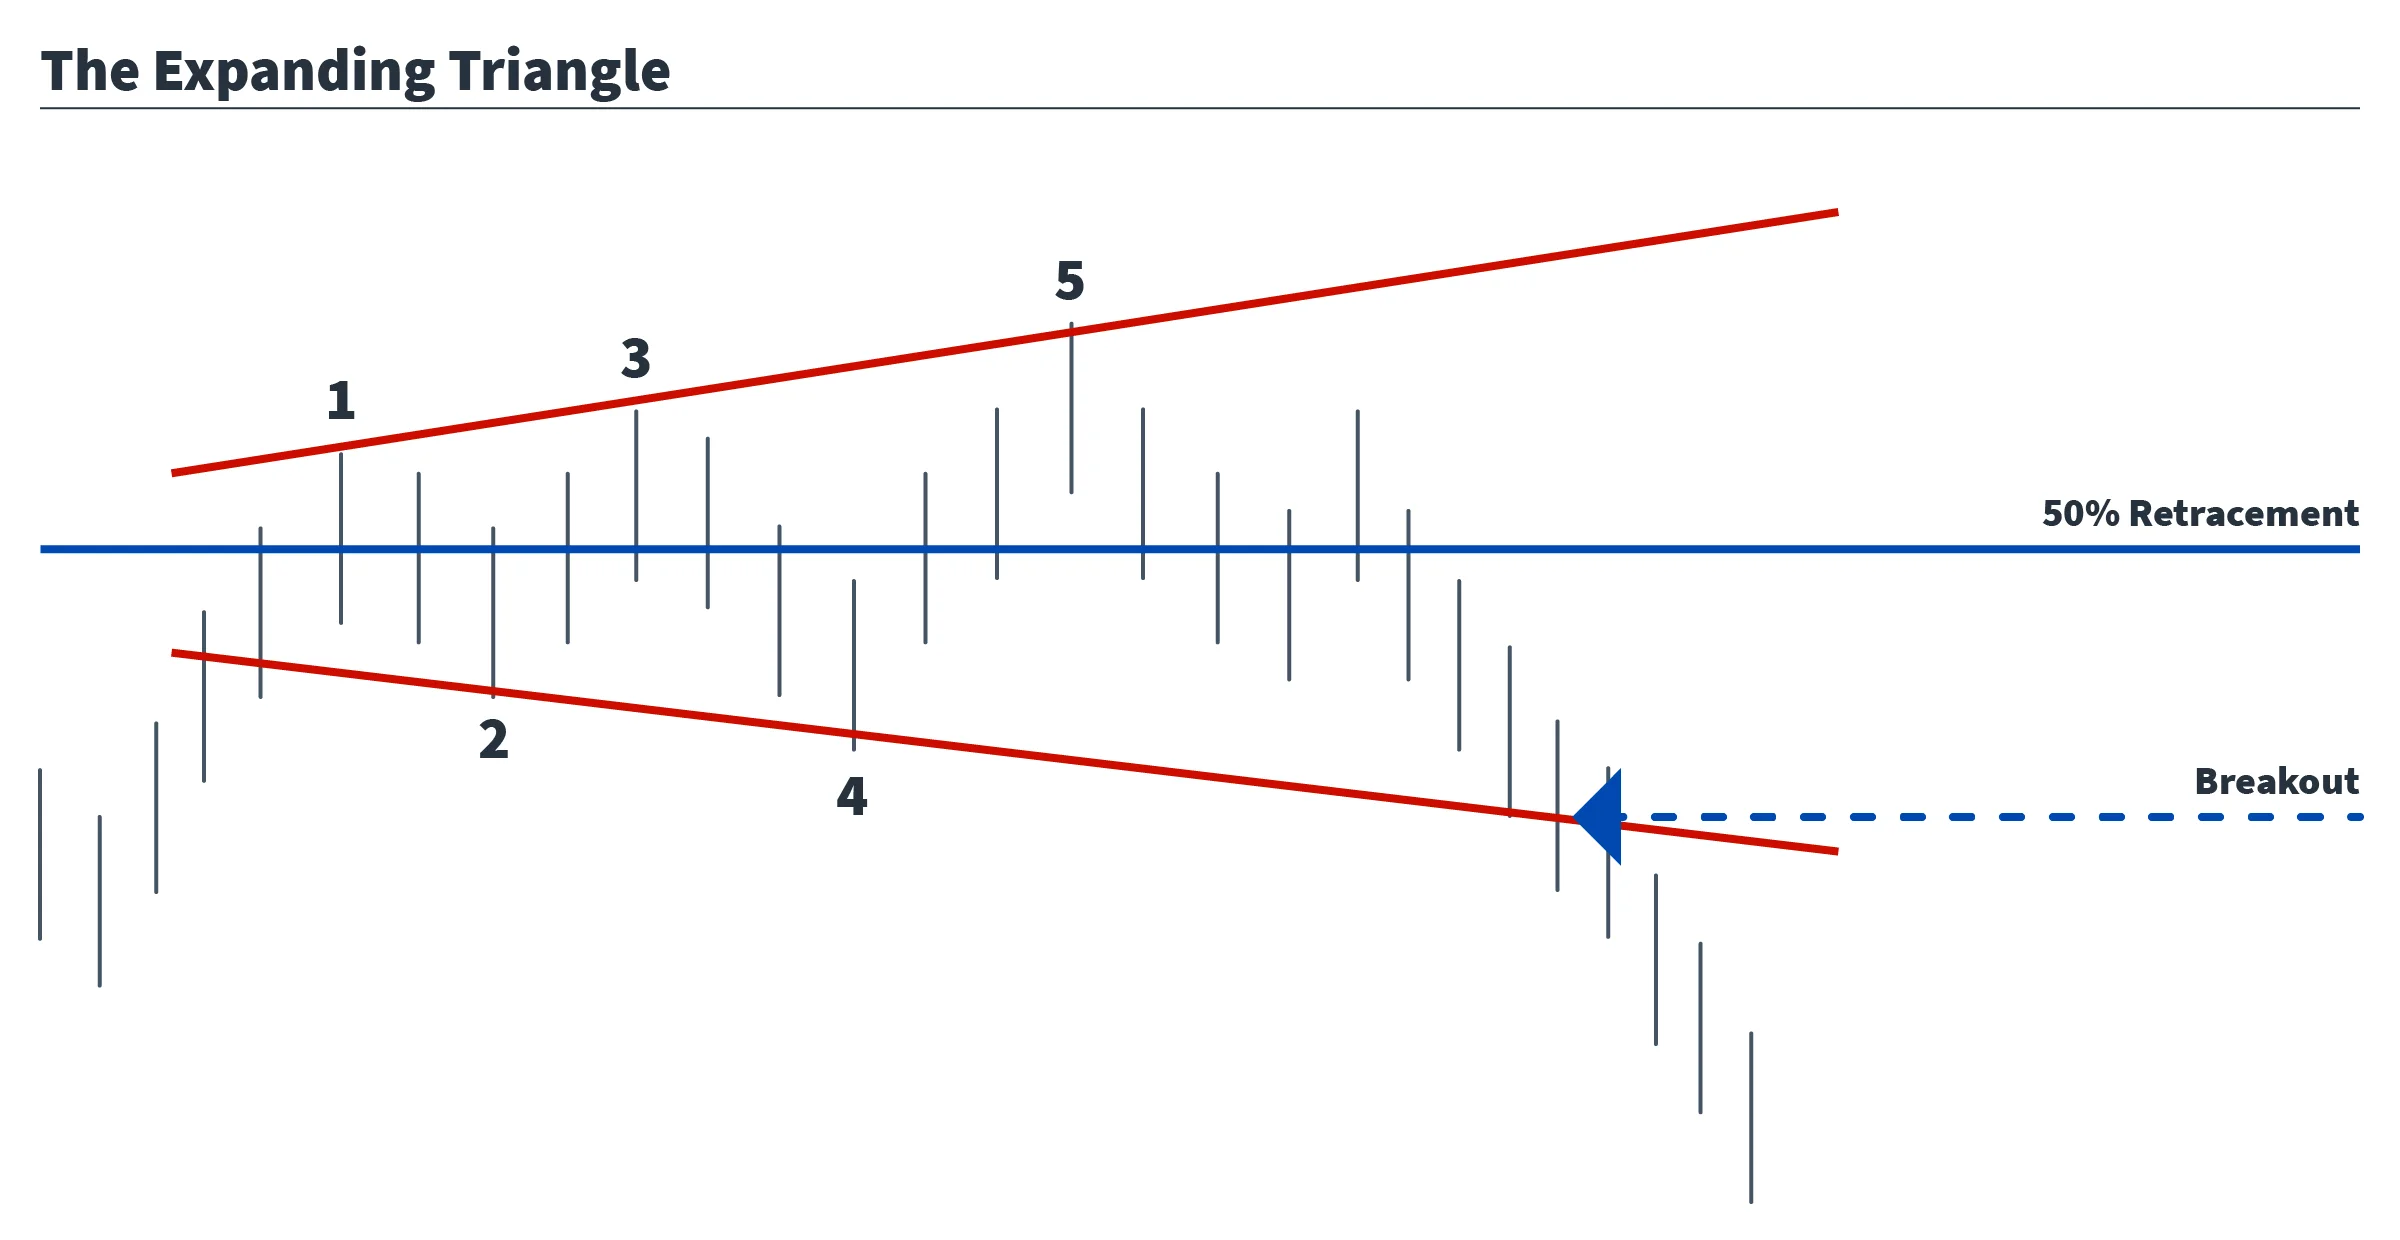
Expanding triangle
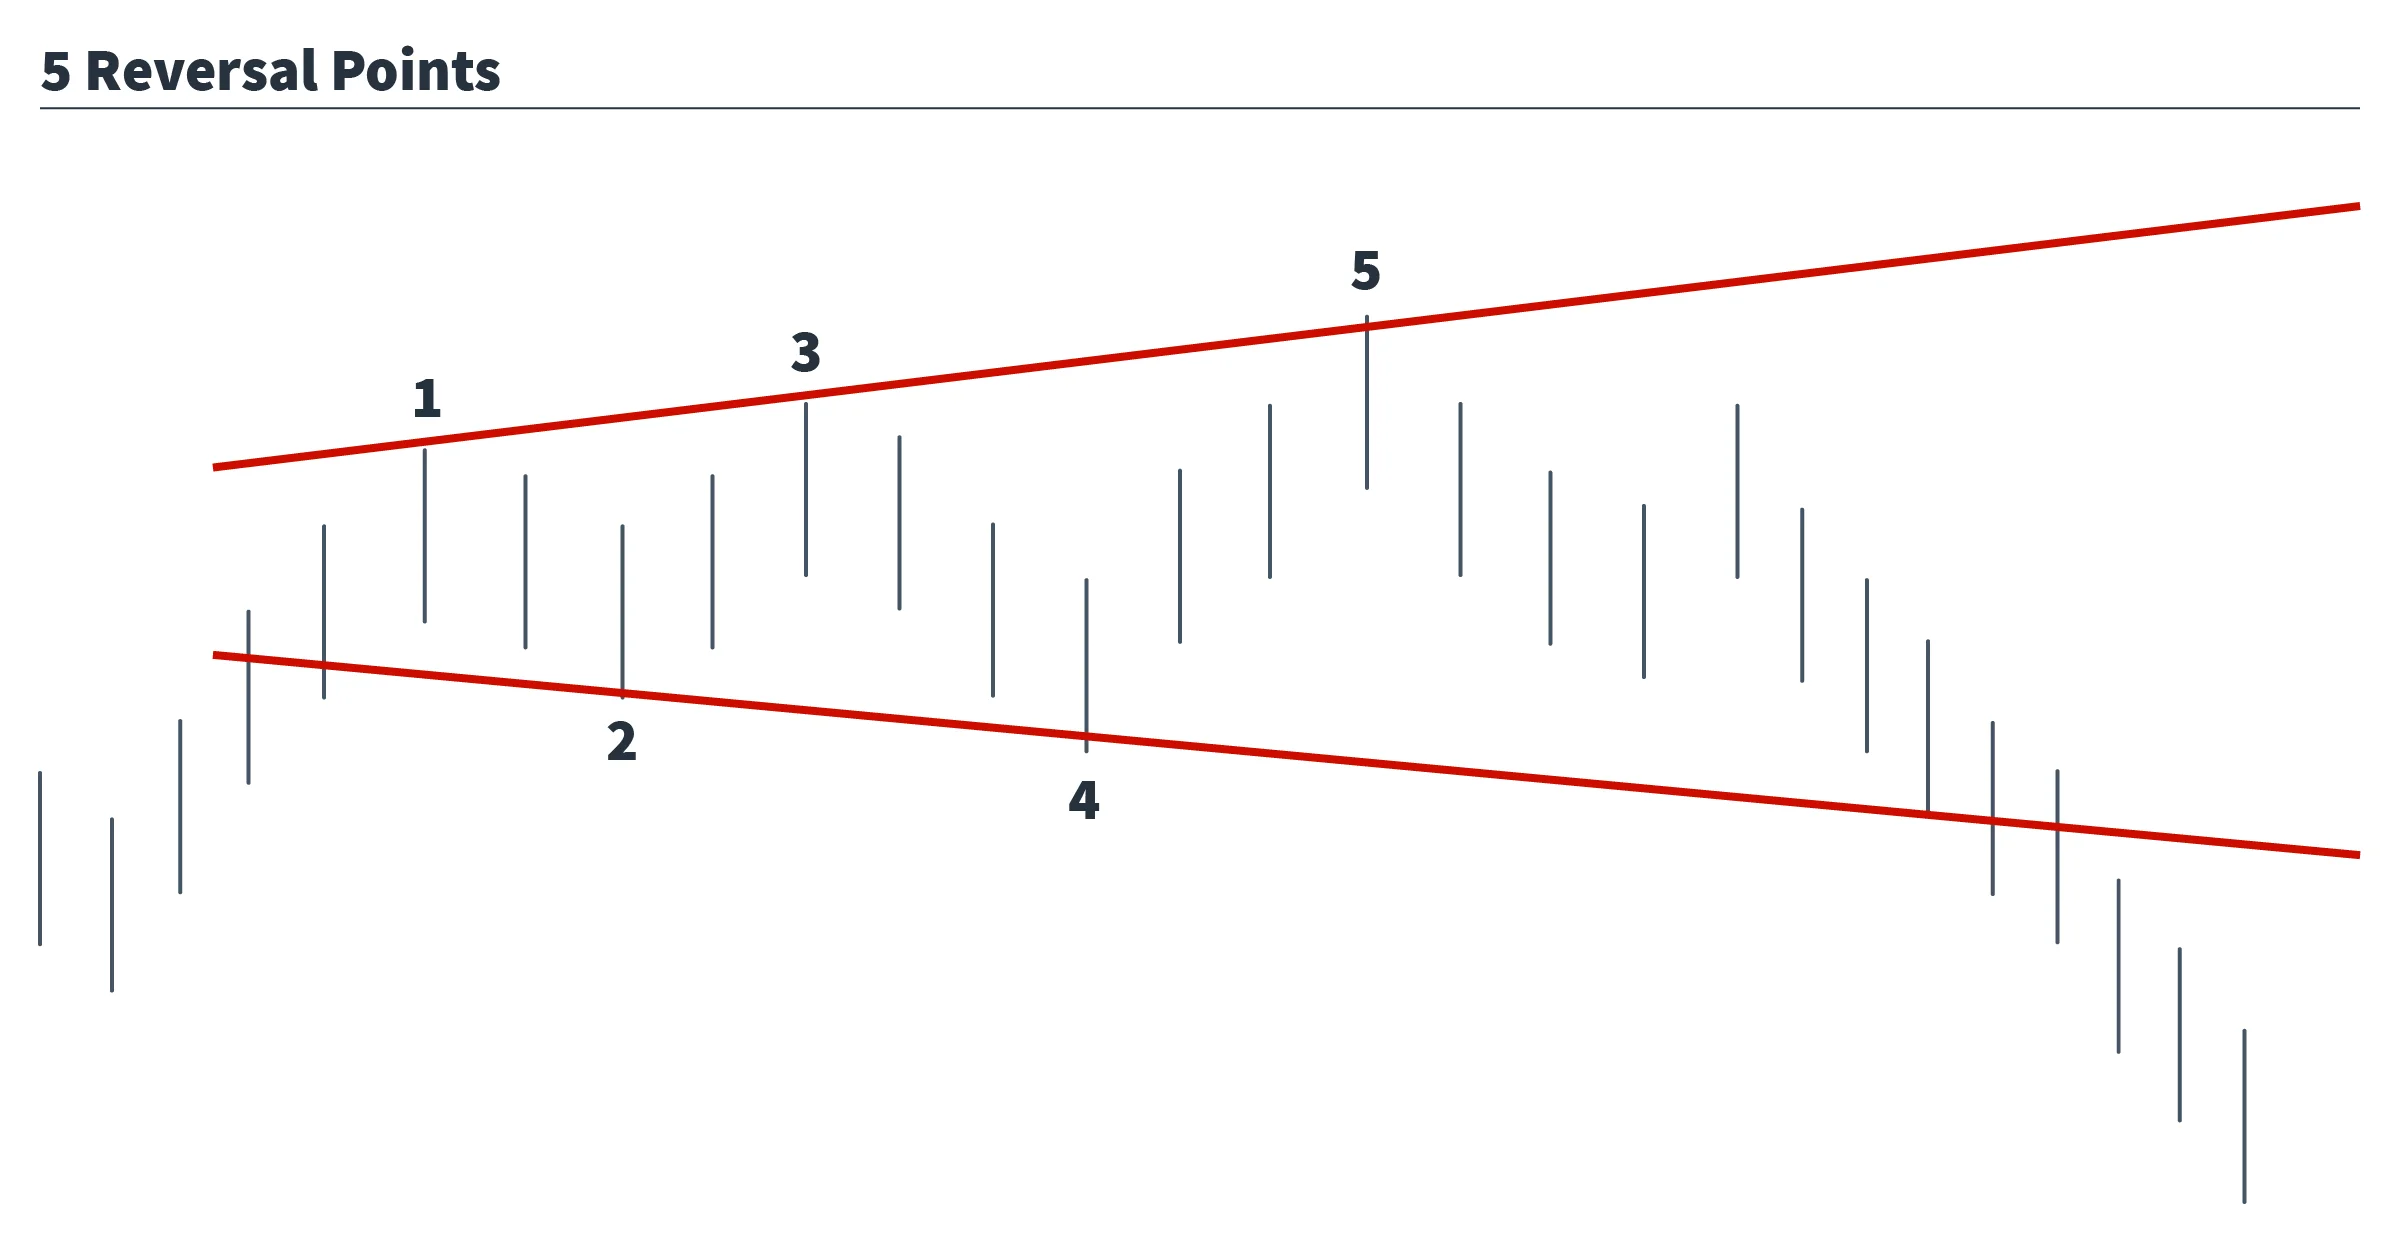
The expanding triangle is typically the most rare of the 4 triangle patterns, and is usually considered to be a bearish setup found at major market tops. Unlike the other patterns, which center around 2 trendlines converging towards each other to form an apex, the expanding triangle is just the opposite, and consists of 2 trendlines starting at an apex and diverging away from each other.
So, instead of seeing a series of lower highs and higher lows, you will see a series of higher highs and lower lows.
The volume pattern is also different. When a symmetrical or A&D setup begins to form, you would expect to see volume dropping as price moves towards the apex. It’s the opposite for the expanding pattern, where you should see volume start to grow as price continues to expand.
The last major difference that makes the expanding pattern unique is that it requires a minimum of 5 reversal points to be confirmed, as opposed to the other 3 triangle setups, which require a minimum of 4 reversal points, with a breakout typically occurring after the 5th reversal.
How to trade it
This is definitely the most confusing of the triangle patterns, and breakout traders tend not to use it as a trade setup unless it falls in line with a number of other indicators. The high probability of false signals and wide retracement ranges make it a nightmare for managing risk, so it is most often used as a signal that a change in trend is occurring.
Short terms traders have been known to use the diverging trendlines for scalping or day trading purposes. If the pattern is correctly identified in its early stages, the upper and lower trendlines can be considered support and resistance areas, with stops outside the breakout areas and profit targets in the area of a 50% retracement.
For more conservative traders, a typical price target after a breakout is measured by the distance from the last touch of the upper trendline to the breakout price, with stops at the 50% retracement market. False breakouts and retracements are common with this setup; that’s why it is rarely used for breakout trade purposes.
More aggressive traders will assume that a change in trend is developing as soon as they see the pattern begin to form and use the upper trendline as a resistance area to sell against. This is the least risky approach, but there is always the possibility of another higher high.
As with any other trade setup, you should know where you’re getting out before you get in. Proper risk management is the key to keeping yourself in the game for another day.