

Top things to watch this week
The Economic Calendar:
MONDAY: No Economic Reports Scheduled
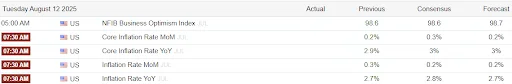
TUESDAY: NFIB Small Business Optimism Index (5:00a CT), CPI (7:30a CT), Redbook (7:55a CT), Fed Barkin Speech (9:00a CT), Fed Schmid Speech (9:30a CT), WASDE Report (11:00a CT), Monthly Budget Statement (1:00p CT), API Crude Oil Stock Change (3:30p CT)
WEDNESDAY: MBA Mortgage Applications (6:00a CT), Fed Barkin Speech (6:30a CT), EIA Petroleum Status Report (9:30a CT), Fed Goolsbee Speech (12:00p CT), Fed Bostic Speech (12:30p CT)
THURSDAY: Jobless Claims (7:30a CT), PPI (7:30a CT), EIA Natural Gas Report (9:30a CT), Fed Barkin Speech (1:00p CT), Fed Balance Sheet (3:30p CT)
FRIDAY: Import/Export Prices (7:30a CT), Empire State Manufacturing Index (7:30a CT), Retail Sales (7:30a CT), Industrial Production/Capacity Utilization (8:15a CT), Business Inventories (9:00a CT), University of Michigan Consumer Sentiment (9:00a CT), Retail Inventories (9:00a CT), NOPA Crush Report (11:00a CT), Baker Hughes Rig Count (12:00p CT)
Key Events:
- Summer trade sees many traders on holiday, so expect light trading volumes with moments of volatility.
- On Friday, a scheduled meeting between Trump and Russian President Putin to discuss a truce that would involve “swapping of territories” between Russia and Ukraine.
- Traders are closely watching CPI (inflation) data as tariffs kick in.
- Economic data of note on CPI, PPI, and Retail Sales.
- WASDE reports and their effect on low grain futures prices.
- FOMC speakers – Schmid, Barkin, Goolsbee, and Bostic.
Boredom is the competitive advantage of the patient trader
The summer trading doldrums are here, while everyone else is forcing trades into sideways chop, bleeding five tics here and 100 tics there just to feel productive, you’re doing what apex predators do—conserving energy for the kill shot.
The A+ setups don’t emerge from exciting, volatile markets—they emerge from the boring, grinding, soul-crushing action that makes 90% of traders throw in the towel.
Your summer patience is directly setting up your autumn profits. When volatility returns and trends establish themselves, you’ll be fresh, funded, and ready while others are already beaten down by months of overtrading mediocre setups.
Most professional traders reduce their summer activity not because they’re lazy, but because they understand that preservation of capital during low-opportunity periods is what allows them to capitalize when high-opportunity periods emerge. Your job isn’t to make money every day—it’s to be positioned perfectly for the days when the market hands out real money. Those days are coming, but only if you have the discipline to wait for them.
Inflation (CPI) data
The headline inflation is projected to rise to 2.8% year-over-year, and core CPI is expected to increase to 3% from 2.9%.
Stock index futures
The “buy the dip” mentality appears to have returned, with the S&P 500 futures recording their best weekly performance since late June, up 0.81%.
The rebound was driven by a confluence of factors, including a reversal from a weak July jobs report, a surge in technology stocks, a largely solid batch of quarterly earnings, and renewed hopes for a truce between Russia and Ukraine. Traders also absorbed a flurry of new tariff updates with a surprisingly muted reaction.
From a technical perspective, sellers were unable to push ranges below the lows of the previous week, a failure that suggests the bullish momentum remains intact. However, analysts note that should the market close beneath those levels, a new nascent downtrend would be confirmed in the daily data.
The latest round of tariffs, which took effect this week, had a notably muted impact on market sentiment compared to previous actions. This subdued reaction, combined with growing speculation about a potential September rate cut, contributed to a risk-on environment. Optimism for easier monetary policy was fueled by recent poor labor market data and President Trump’s nomination of Stephen Miran to the Federal Reserve.
Earnings yield
The latest corporate earnings season is generating an unusually high degree of volatility, with stocks seeing their most dramatic one-day price reactions in years.
According to a recent analysis, the average stock that has reported earnings this week has experienced a one-day share price swing of more than +/-8.5%, significantly surpassing the 20-year historical average of +/-5.75%.
During the early 2000s, before the financial crisis, the average stock’s one-day earnings reaction was just over +/-5%. This figure spiked to a record above +/-7% during the financial crisis, a period marked by heightened overall market volatility and investor panic. Following the crisis, volatility on earnings days returned to the +/-5% range from 2010 to 2015. However, since 2015, the trend has reversed, with earnings-day volatility for stocks steadily increasing.
In 2018, the average move exceeded +/-6% for the first time since the crisis, and aside from a brief dip in 2021, it has continued to climb, reaching nearly +/-7% in 2024 and so far in 2025. This year, the average stock has seen a one-day move of +/-6.86% in response to its quarterly report.
Japanese yen futures
The Bank of Japan (BOJ) is signaling a potential interest rate hike by year-end 2025, driven by rising inflationary pressures and a robust economic outlook.
Analysts predict a possible 25-basis-point hike to 0.75% or 1% by year-end if inflation and wages remain strong.
Despite maintaining its benchmark rate at 0.5%, the BOJ raised its inflation forecast for fiscal 2025-26 to 2.7% from 2.2%, citing persistent food price increases, particularly rice, and steady wage growth.
Core inflation hit a 16-month high of 3% in December 2024, and Tokyo’s CPI rose to 3% year-on-year, reinforcing expectations of tighter monetary policy.
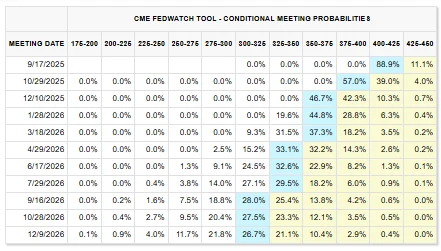
Interest rate futures
Seventy-five basis points of Fed cuts are now priced in by January 2026, suggesting reductions at three of the following four meetings.
The front-runner for the next Federal Open Market Committee (FOMC) Chair is not definitively clear, as multiple candidates are in contention to replace Jerome Powell, whose term ends in May 2026.
However, recent reports and betting markets suggest Christopher Waller and Kevin Warsh are leading candidates.
WALLER EMERGES AS FAVORITE FOR FED CHAIR AMONG TRUMP TEAM
- Christopher Waller, a current Fed Governor appointed by Trump in 2020, is cited as a top contender due to his pragmatic, data-driven approach and alignment with Powell’s policies. However, he has indicated openness to rate cuts sooner than Powell, as seen in his dissent to hold rates steady in July 2025. Bloomberg News reported Waller as a favorite among Trump’s team, with Polymarket odds at 35% for him as of August 2025.
- Kevin Warsh, a former Fed Governor (2006-2011), is also a strong contender, frequently mentioned for his criticism of the Fed’s current policies and alignment with Trump’s preference for lower rates. His market-friendly profile and past consideration for the role in 2017 bolster his position, with Polymarket odds at 35% alongside Waller.
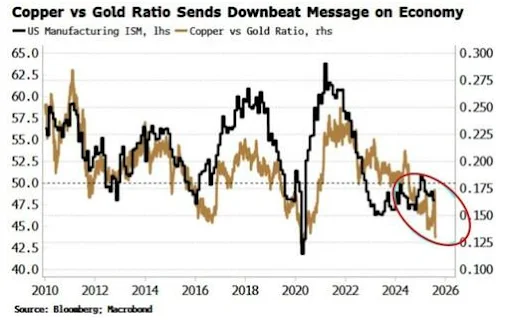
Copper / Gold ratio (economic bellweather)
A market-based barometer of economic health, the copper-to-gold ratio, is signaling a potential weak patch ahead for the U.S. economy. While recent weeks have been consumed by a heated debate over the size of payrolls revisions and the subsequent dismissal of the Bureau of Labor Statistics chief, a longer-term indicator is also pointing toward a cyclical slowdown.
The ratio, which pits industrial bellwether copper against safe-haven gold, has historically served as a reliable guide for the economy’s ups and downs, effectively capturing a shift from “risk-on” to “risk-off” market behavior.
Although the recent slump was sharply exacerbated by the Trump administration’s 50% tariff on most types of copper imports, the ratio’s decline was already in motion. Its movements have shown a close historical correlation with the U.S. manufacturing ISM index, suggesting that the recent price action may reflect more than just trade policy, hinting at softening economic activity.
Gold futures
Gold hits all-time high after U.S. slaps new tariffs on Swiss bullion imports – NY gold futures trade above $3,534/oz.
Recent rumors in the gold futures market center on significant price volatility driven by new U.S. tariffs on imported 1-kilogram and 100-ounce gold bars, particularly impacting Switzerland, a major gold refining hub.
On August 8, 2025, gold futures on the COMEX surged to a record high of $3,534.10 per ounce, a 2.3% increase, following reports of a 39% tariff imposed by the
Trump administration. This caused a premium of over $100 per ounce over spot prices, which remained relatively stable at around $3,380-$3,400.
The tariffs have sparked market uncertainty, with some traders halting gold shipments to the U.S. due to the potential disruption in the global bullion trade. The White House has indicated plans to clarify its stance, leading to some price pullback to around $3,454-$3,484 per ounce.
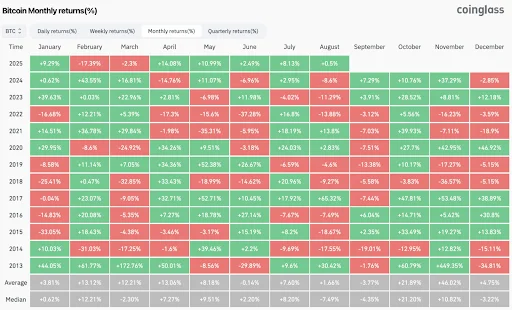
Bitcoin futures
Bitcoin has recently slipped below the $116,000 mark, entering what some analysts are calling a low-liquidity “air gap” where few coins have changed hands.
The move comes as short-term holder profitability hits a bull market mid-line, ETF flows have turned negative, and funding rates have begun to cool. The market is now searching for support amid a significant debate over the cryptocurrency’s future volatility profile.
For years, Bitcoin’s hallmark volatility was a key draw for both retail and institutional investors, offering the potential for outsized returns. However, with the launch of spot Bitcoin ETFs, this volatility has begun to diminish.
According to Bloomberg’s Eric Balchunas, the 90-day rolling volatility for Bitcoin has dropped below 40% for the first time, a stark contrast to the over 60% level at the time of the ETF launches. This has made Bitcoin less than twice as volatile as gold, compared to being more than three times as volatile previously.
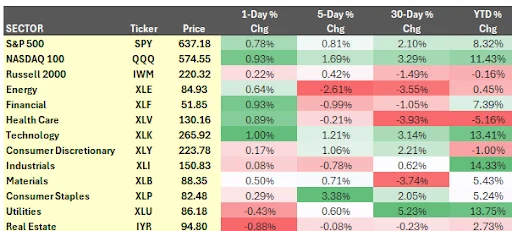
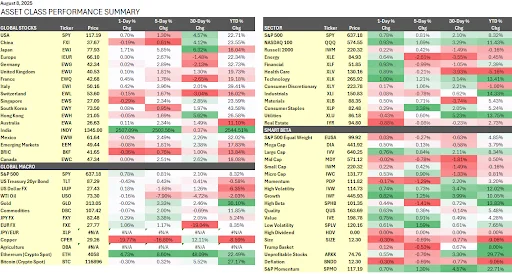
Asset class performance summary
These performance charts track the daily, weekly, monthly, and yearly changes of various asset classes, including some of the most popular and liquid markets available to traders.
All content published and distributed by Topstep LLC and its affiliates (collectively, the “Company”) should be treated as general information only. None of the information provided by the Company or contained herein is intended as (a) investment advice, (b) an offer or solicitation of an offer to buy or sell, or (c) a recommendation, endorsement, or sponsorship of any security, Company, or fund. Testimonials appearing on the Company’s websites may not be representative of other clients or customers and is not a guarantee of future performance or success. Use of the information contained on the Company’s websites is at your own risk and the Company, and its partners, representatives, agents, employees, and contractors assume no responsibility or liability for any use or misuse of such information.
Futures trading contains substantial risk and is not for every investor. An investor could potentially lose all or more than the investor’s initial investment. Only risk capital—money that can be lost without jeopardizing one’s financial security or lifestyle—should be used for trading, and only those individuals with sufficient risk capital should consider trading. Nothing contained herein is a solicitation or an offer to buy or sell futures, options, or forex. Past performance is not necessarily indicative of future results.
CFTC Rule 4.41 – Hypothetical or Simulated performance results have certain limitations. Unlike an actual performance record, simulated results do not represent actual trading. Also, because the trades have not actually been executed, the results may have under-or-over compensated for the impact, if any, of certain market factors, such as lack of liquidity. Simulated trading programs, in general, are also subject to the fact that they are designed with the benefit of hindsight. No representation is being made that any account will or is likely to achieve profit or losses similar to those shown.