

Top things to watch this week
The Economic Calendar:
MONDAY: Fed Balance Sheet (3:30p CT)
TUESDAY: NFIB Business Optimism Index (5:00a CT), Redbook (7:55a CT), Used Car Prices (8:00a CT), Consumer Inflation Expectations (10:00a CT), 3-Year Note Auction (12:00p CT), Consumer Credit Change (2:00p CT)
WEDNESDAY: MBA Mortgage Applications (6:00a CT), Wholesale Inventories (9:00a CT), EIA Petroleum Status Report (9:30a CT), 10-Year Note Auction (12:00p CT), FOMC Minutes (1:00p CT)
THURSDAY: Jobless Claims (7:30a CT), Fed Musalem Speech (9:00a CT), EIA Natural Gas Report (9:30a CT), 30-Year Bond Auction (12:00p CT), Fed Waller Speech (12:15p CT), Fed Daly Speech (1:30p CT), Fed Balance Sheet (3:30p CT)
FRIDAY: WASDE Report (11:00a CT), Baker Hughes Rig Count (12:00p CT), Monthly Budget Statement (1:00p CT)
Key Events:
- It’s a lite trading week as the U.S. returns from the July 4th holiday hangover weekend.
- Traders are watching the FOMC minutes, but not any other economic reports of note.
- The tariff and trade narrative is back in focus as the July 9 deal deadline looms.
- Oil Traders are watching as OPEC+ increases its supply over the weekend.
- Q2 earnings season officially kicks off on July 14.
- The stock valuations looked stretched for long-term holders of equities.
- Technicals, flows, and sentiment are leading the charge higher in equities.
- Gold futures are in a consolidation and waiting for the next move.
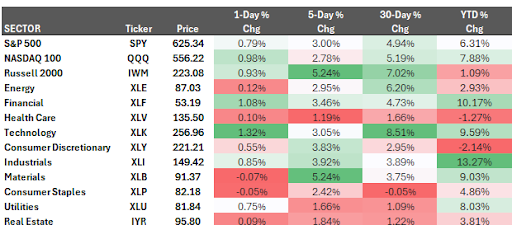
Stock index futures
U.S. S&P 500 index futures opened Friday night’s session on the back foot (-0.60%), retreating after the cash market closed at a fresh all-time high. The catalyst: renewed trade and tariff headwinds as American trade partners pushed for concessions ahead of the July 9th deadline. President Trump ratcheted up tensions after Thursday’s close, reportedly warning partners that he could unilaterally impose levies as high as 70% as early as today.
This aggressive stance instantly revived the “trade and tariff headwinds” narrative, overshadowing any positive sentiment. Notably, even the signing of “The Big Beautiful Bill” seemed to elicit a classic “buy the rumor, sell the news” reaction from the market, which largely shrugged it off.
After a decent run in June and some fresh all-time highs for the S&P, this Q2 earnings cycle is the next major catalyst that will either justify current valuations or trigger some serious unwinds.
“Earnings Guidance is King” (as always). Forget the backward-looking Q2 numbers if the forward commentary isn’t solid. With trade tensions flaring up again and the Fed still playing a patient game, what management says about the second half of the year’s outlook, demand, costs, and especially the impact of tariffs will dictate price action more than the beat or miss itself. Pay close attention to revenue guidance – can they actually grow the top line, or is it all about cost-cutting?
Euphoric market feeling
The adrenaline is pumping, and I’ve got that classic “euphoric feeling” coursing through my veins – FOMO is absolutely raging right now. It’s tough to fight the urge to just pile in.
However, a dose of reality is warranted. Global markets are still grappling with an unresolved trade war led by the Trump administration, which remains a significant source of uncertainty. This “Russian-Ukraine and Iran-Israel wars” is set to continue generating headwinds for global growth and fueling day-to-day market volatility. Expect high-flying global stocks to face corrections as macroeconomic data softens, creating a more favorable environment for haven assets.
The bottom line is that valuations are stretched. While the sentiment might feel fantastic, the underlying risks, particularly from this persistent trade friction, suggest that caution is paramount. It’s a tricky balance between riding the wave and respecting the headwinds.
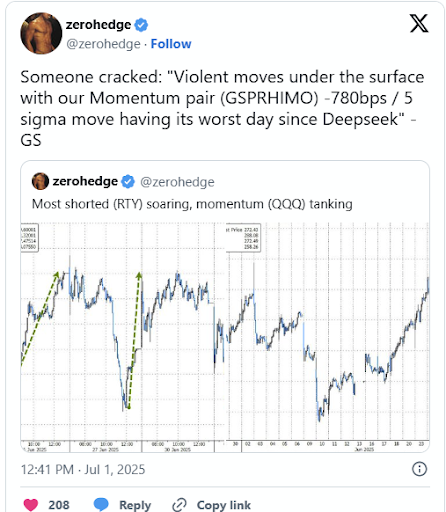
Stock momentum factor warning
Momentum factor portfolios just saw their sharpest single-day decline since “Deep Seek January,” a significant drawdown given their outsized performance year-to-date.
While the S&P 500 and Nasdaq are up a modest 5% after recovering from double-digit losses earlier, various momentum baskets have surged into double-digit gains. Notably, the Goldman Momentum Pair basket and Goldman High Beta Momo Pair closed the first half of the year up a robust 20%.
The critical question for traders now is how to effectively protect against further momentum unwinds, especially with increasing “event” risk on the horizon.
Goldman Sachs’s derivatives desk is suggesting specific hedge structures for this scenario:
- Small Cap Calls: Consider buying calls on small caps, specifically the IWM July 25 5% Out-of-the-Money (OTM) calls, which are priced around 35 basis points (bps).
- “Low Momentum” Index Calls: Another strategy is to buy calls on the “low momentum” index, such as the Dow Jones 1-month 5% OTM call.
These hedges aim to provide protection should the recent momentum unwinds continue or accelerate, offering tactical exposure against a potential rotation out of highly performing momentum names.
Pondering
“The ultimate luxury is doing something every day that you love doing with people that you love doing it with.” Warren Buffett
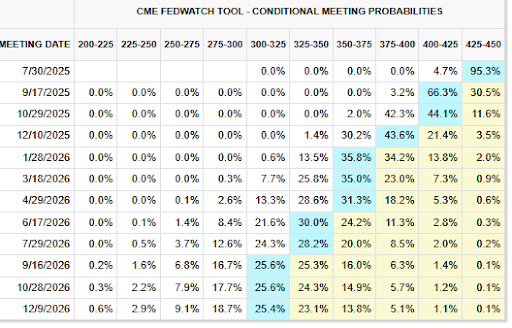
Interest rate futures
The market’s expectation for the July 30th FOMC interest rate decision remains firmly anchored, with the probability of no change still hovering around 95%. This resolve follows last Thursday’s stronger-than-expected nonfarm payrolls report, which significantly pared back rate cut expectations.
Specifically, September’s cumulative cuts are now priced at just 19 basis points (bps), down sharply from 28 bps ahead of the NFP print. Looking further out, only 51bp of total cuts are now priced through the December FOMC meeting.
Despite this recalibration in near-term expectations, the broader narrative still suggests that the Federal Reserve will move closer to easing policy in the second half of the year. The persistent “shadow chair” speculation regarding a potential successor to Jerome Powell continues to reinforce market bets on looser monetary policy, irrespective of who ultimately takes the helm. For now, the NFP data has given the Fed more breathing room to maintain its patient stance.
Despite this, President Trump has made an effort to clarify to the public what expectations are, and if he has his way, there will be lower interest rates.
Crude oil futures
Crude oil futures are poised to face downward pressure as the market opens Sunday evening. The key catalyst is the OPEC+ decision over the weekend to increase production by 548,000 barrels per day (bpd) in August, a figure significantly higher than the market’s expectation of 411,000 bpd. This move marks a shift for the influential group, which accounts for roughly half of global oil output, reversing its 2022 curtailment strategy. The pivot aims to regain market share and responds directly to U.S. President Trump’s calls for increased pumping to temper gasoline prices.
These larger-than-anticipated supply increases are expected to ensure the global oil market remains comfortably supplied through the remainder of the year. Furthermore, the geopolitical risk premium that recently bolstered prices has rapidly eroded following the ceasefire between Israel and Iran. The prospect of a well-balanced oil market, combined with substantial OPEC spare production capacity, is providing effective comfort to market participants. Expect a bearish lean into the early week trade.
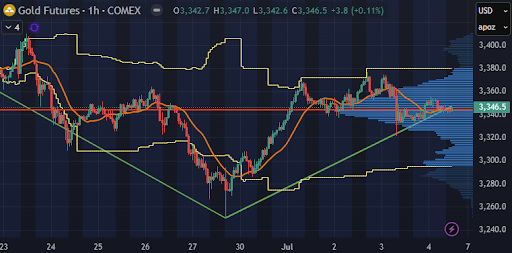
Gold futures
Gold is currently consolidating in the middle of its recent range, characterized by notably light volume and a virtually unchanged open interest (OI) that has remained stable for over 60 days. This stagnant OI largely stems from the significant inventories occupying at least half of the short side of the book. Crucially, the traditional speculative community in America isn’t actively engaged on the long side, rendering that end of the OI equally inert.
Indeed, the landscape of “speculators” has fundamentally shifted; meaningful numbers of smaller players are effectively gone. The real constituency in this market now comprises behemoths such as BlackRock, major banks, Citadel, and similar institutional players, which primarily operate through sophisticated algorithms.
Despite this current lack of short-term speculative engagement, gold continues to garner favor as a strategic asset. Underlying demand remains robust, particularly from global central banks aggressively buying to diversify their reserves. This trend, reinforced by recent industry surveys, suggests a largely one-way demand channel, as central bank purchases rarely reverse. Furthermore, global holdings in bullion-backed Exchange Traded Funds (ETFs) have swelled to their largest levels since mid-2023, signaling strong non-official demand that is expected to continue driving further inflows. Although the immediate chart appears quiet, these structural tailwinds suggest a robust long-term fundamental story.
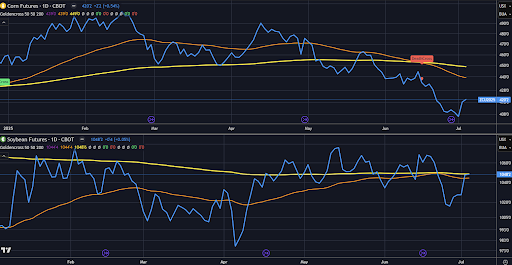
Grain futures
The latest USDA reports have delivered a mixed bag for the ags complex, with key acreage and quarterly stock figures influencing supply outlooks. Traders need to note the nuances, as not all numbers align with expectations.
Acreage Outlook:
- Corn: We’re looking at an increase in 2025 corn acreage to 95.2 million acres, up from 90.6 million last year. This is largely as expected, although there is a slight trim from the prior estimate of 95.3 million. This larger planting should help bolster supply.
- Soybeans: Plantings are projected to drop to 83.4 million acres for 2025, down from 87.1 million in 2024 and slightly below March’s 83.5 million estimate. This reduction could tighten the supply side, all else being equal.
- Wheat: Estimates were trimmed to 45.5 million acres, below 2024’s 46.1 million, but marginally above the previous 45.4 million projection.
Quarterly Stocks – Where the Surprises Hit:
- Corn Inventories: As of June 1st, corn stocks came in at 4,644 million bushels, down 7% year-on-year and largely in line with market consensus of 4,625 million bushels. This slightly tighter-than-expected stock level provides some support.
- Soybean Inventories: This was a notable surprise. Inventories jumped 4% year-on-year to 1,008 million bushels, significantly higher than the 974 million bushels the market was anticipating. This is a clear bearish signal for soybeans, indicating more supply than previously priced in.
- Wheat Inventories: Similarly, wheat stocks were reported at 851 million bushels, representing a substantial 22% year-over-year increase and exceeding market expectations of around 836 million bushels. This, too, presents a bearish overhang for wheat prices.
Trading Implications: The acreage figures paint a somewhat stable picture for corn, while soybeans and wheat face potential headwinds from reduced plantings but significantly higher-than-expected inventories. The larger-than-forecast stocks for soybeans and wheat are the immediate takeaways, suggesting potential pressure on prices for these two commodities as we head deeper into the summer. Corn, while seeing higher acreage, had its stock figure largely match expectations, suggesting less immediate downside shock from inventories.
Keep an eye on demand drivers and weather developments that could shift this balance.
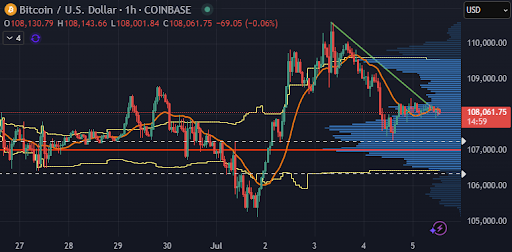
Crypto futures
Bitcoin (BTC) futures experienced a brief breakout from their recent trading channel, surging to $110,500 by Thursday’s close, ahead of the July 4th holiday. However, that upward momentum quickly faded, with prices retracing back into the channel at $108,060 as of the time of writing.
This price action coincides with early signs of summer seasonality returning to the crypto markets. Total Bitcoin futures volume for June recorded a notable 20% month-over-month (MoM) decline, with centralized exchanges accounting for just $1.55 trillion in volume. For context, this is 20% below the $1.93 trillion average monthly volume seen over the first five months of 2025.
This trend isn’t new. Last year, June 2024’s total Bitcoin futures volume dropped 15.7% MoM, leading to a consistently lower average monthly volume of $1.53 trillion from June through September 2024, compared to the $1.71 trillion average of the preceding five months. A similar pattern emerged in 2023, albeit starting in July, where volumes sharply declined by ~30% MoM in July, followed by further drops through September.
While it’s still early to call with absolute certainty, the June 2025 data strongly suggests we could be on track for another typically muted summer stretch in crypto, indicating that traders might need to adjust their strategies for reduced liquidity and potentially less directional conviction.
All content published and distributed by Topstep LLC and its affiliates (collectively, the “Company”) should be treated as general information only. None of the information provided by the Company or contained herein is intended as (a) investment advice, (b) an offer or solicitation of an offer to buy or sell, or (c) a recommendation, endorsement, or sponsorship of any security, Company, or fund. Testimonials appearing on the Company’s websites may not be representative of other clients or customers and is not a guarantee of future performance or success. Use of the information contained on the Company’s websites is at your own risk and the Company, and its partners, representatives, agents, employees, and contractors assume no responsibility or liability for any use or misuse of such information.
Futures trading contains substantial risk and is not for every investor. An investor could potentially lose all or more than the investor’s initial investment. Only risk capital—money that can be lost without jeopardizing one’s financial security or lifestyle—should be used for trading, and only those individuals with sufficient risk capital should consider trading. Nothing contained herein is a solicitation or an offer to buy or sell futures, options, or forex. Past performance is not necessarily indicative of future results.
CFTC Rule 4.41 – Hypothetical or Simulated performance results have certain limitations. Unlike an actual performance record, simulated results do not represent actual trading. Also, because the trades have not actually been executed, the results may have under-or-over compensated for the impact, if any, of certain market factors, such as lack of liquidity. Simulated trading programs, in general, are also subject to the fact that they are designed with the benefit of hindsight. No representation is being made that any account will or is likely to achieve profit or losses similar to those shown.