
Top things to watch this week
The Economic Calendar:
MONDAY: Empire State Manufacturing Index (7:30a CT), NOPA Crush Report (11:00a CT)
TUESDAY: Import & Export Prices (7:30a CT), Retail Sales (7:30a CT), Redbook (7:55a CT), Industrial Production/Capacity Utilization (8:15a CT), Business Inventories (9:00a CT), NAHB Housing Market Index (9:00a CT), 20-Year Bond Auction (12:00p CT), API Crude Oil Stock Change (3:30p CT), 2-Day FOMC Meeting Begins
WEDNESDAY: MBA Mortgage Applications (6:00a CT), Building Permits (7:30a CT), Housing Starts (7:30a CT), EIA Petroleum Status Report (9:30a CT), Fed Interest Rate Decision (1:00p CT), Fed Chair Press Conference (1:30p CT)
THURSDAY: Jobless Claims (7:30a CT), Philly Fed Manufacturing Index (7:30a CT), CB Leading Index (9:00a CT), EIA Natural Gas Report (9:30a CT), Foreign Bond Investment (3:00p CT), Fed Balance Sheet (3:30p CT)
FRIDAY: Baker Hughes Rig Count (12:00p CT)
Key Events:
- U.S. government shutdown looms on October 1.
- FOMC interest rate decision and press conference on Wednesday, as market prices expect a 25 basis point rate cut.
- A slew of August activity data – Retail Sales, Industrial Production, and Housing Starts.
- Key earnings report from FedEx (FDX) and close attention to the tariff effects.
- FOMC speakers on media blackout until after the FOMC announcement.
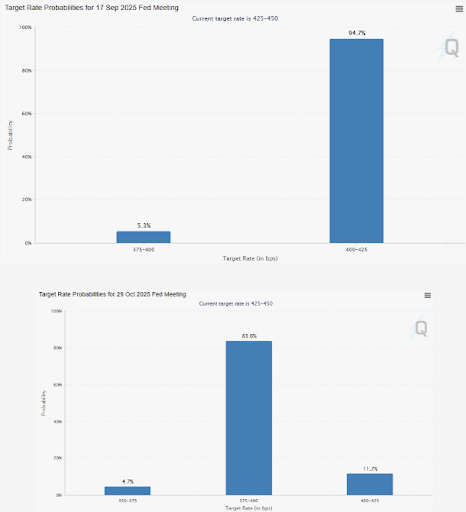
FOMC interest rate decision
The Fed Funds market is pricing in a 95% chance of a 25 basis point (bp) rate cut, and a 5% chance of a 50 bp cut at the meeting this week.
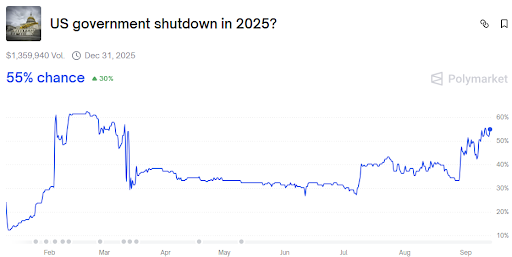
U.S. government shutdown looms
The political circus of a last-minute budget extension is looming. Congress often passes a temporary measure called a “continuing resolution” (CR) just before the deadline to keep the government running while they work out a long-term budget deal. These last-minute agreements have become a common, though often criticized, part of the budget process in recent decades.
As the September 30 deadline for government funding approaches, Congress is locked in a high-stakes standoff with both parties attempting to control the public narrative. President Trump has proposed a continuing resolution to extend government funding through January 31, 2026.
However, Democrats are resisting a simple extension unless it also includes a provision to extend key tax credits under the Affordable Care Act (ACA), which are set to expire at the end of the year.
As the clock ticks, the likelihood of a government shutdown on October 1 continues to rise.
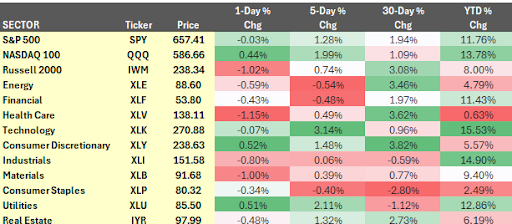
Stock futures
The S&P 500 traded higher +1.28% and the Nasdaq 100 added +1.99% for the week.
U.S. stock futures, which had been at all-time highs and poised for a potential consolidation, received an unexpected boost last week from a combination of favorable economic data. While the market had braced for a potentially negative inflation surprise, it instead received a powerful dovish signal from both the latest CPI report and a weak labor market update, sending stocks even higher.
The most recent Consumer Price Index report showed that core inflation, while ticking higher, contained underlying components that flowed into a more benign outlook for the Federal Reserve’s preferred inflation gauge, Core PCE. This led to a significant downgrade of some analysts’ inflation forecasts, providing relief for a market that had been fearing a hotter-than-expected number.
Concurrently, while inflation data captured the market’s attention, initial jobless claims printed a surprisingly high number, indicating a notable weakening of the labor market. The combination of a better inflation outlook and signs of a cooling jobs market created a “double whammy” of dovish data points that reinforced the case for aggressive Fed easing.
The market’s reaction was swift and decisive. With analysts now expecting nearly a full embrace of three Fed rate cuts by year-end, stocks that had been trading cautiously squeezed higher.
The demand for upside exposure was also evident in the steepening of index call skew, signaling that traders were eager to add to bullish positions.
Oracle surprise
Oracle Corporation’s stock surged by an unheard-of 25% in after-hours trading, defying an earnings report that missed analyst expectations across the board. The company’s surprising rally, for a company with a $680 billion market capitalization, was fueled not by its recent performance but by a colossal backlog and an ambitious long-term forecast.
For the second quarter, Oracle reported revenue of $14.93 billion, falling short of the estimated $15.02 billion. Crucially, its cloud revenue of $3.3 billion also fell short of the expected $3.38 billion, and its earnings per share of $1.47 came in just below the median estimate.
The stock’s dramatic reaction was triggered by the company’s “Remaining Performance Obligations” (RPO), a measure of its contract backlog. CEO Safra Catz announced that four multi-billion-dollar contracts with just three customers resulted in a 359% increase in RPO to $455 billion. “It was an astonishing quarter—and demand for Oracle Cloud Infrastructure continues to build,” Ms. Catz stated.
The company’s forecast proved equally, if not more, influential. Oracle projected its cloud infrastructure revenue to grow 77% to $18 billion this fiscal year and then to increase to $32 billion, $73 billion, $114 billion, and $144 billion over the subsequent four years. The company asserted that most of this five-year forecast is already secured in its reported RPO.
While investors are betting on Oracle’s long-term growth story, the forecast faces significant scrutiny. Analysts are questioning whether such an aggressive, exponential growth trajectory is sustainable, particularly in an uncertain economic environment.
Interest rate futures
The market’s reaction to dovish CPI and labor data was swift and decisive. Analysts now expect nearly a full embrace of three Fed rate cuts by year-end.
In a divergence from the Federal Reserve, the European Central Bank (ECB) has concluded its rate-cutting cycle. This view was reinforced at its recent meeting, despite updated staff projections showing headline and core inflation falling below 2% in both 2026 and 2027. ECB President Christine Lagarde downplayed these forecasts, arguing that the 2027 projection was very close to the 2% target and that a strong euro was only temporarily dragging inflation lower.
Looking ahead, while the FOMC meeting is the main event for the coming week, the Bank of England’s policy decision is also drawing attention. The BOE is widely expected to keep rates unchanged, though there is considerable uncertainty over its future policy path.
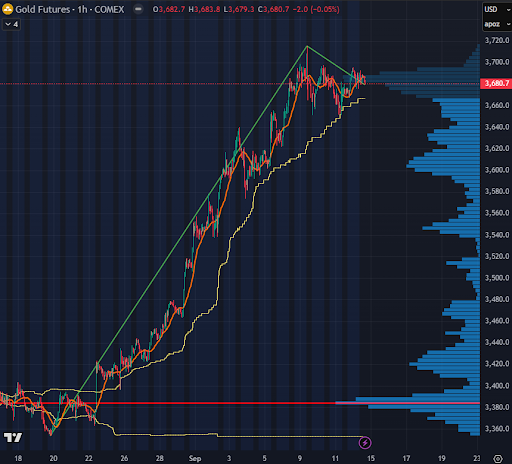
Gold futures
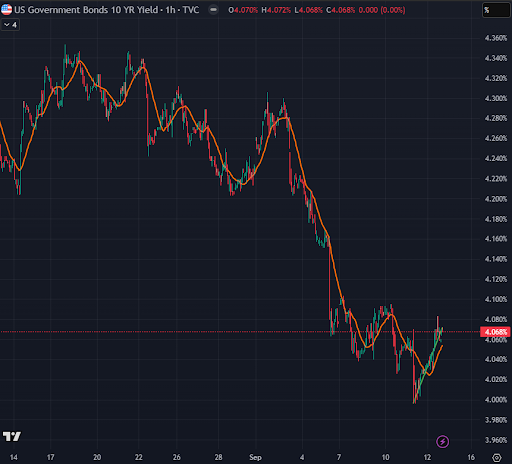
Gold futures keep marching higher.
There is a growing conviction among investors that gold is entering a new upward cycle, one driven by a market dynamic fundamentally different from the one that crushed its last major rally.
The gold bull market of 1980, fueled by panic over inflation and geopolitical uncertainty, was ultimately suffocated by a surge in U.S. 10-year Treasury yields, which climbed above 15%. In that environment, rising real yields—the return on an investment after accounting for inflation—made non-yielding gold a less attractive asset.
Today, however, the situation is reversed. With inflation proving sticky, the Federal Reserve is widely expected to begin an easing cycle, a policy shift that would put downward pressure on interest rates. This environment, where rates are poised to fall even as prices remain elevated, is historically bullish for gold.
Historical analysis shows a consistent pattern: in every easing cycle of the past five decades, gold has delivered strong returns. On average, it has gained 27% in the year following the Fed’s rate cut. This recurring cycle suggests that when faith in fiat currencies begins to slip and liquidity returns to the market, investors consistently turn to the tangibility of gold, prompting a forceful price response.
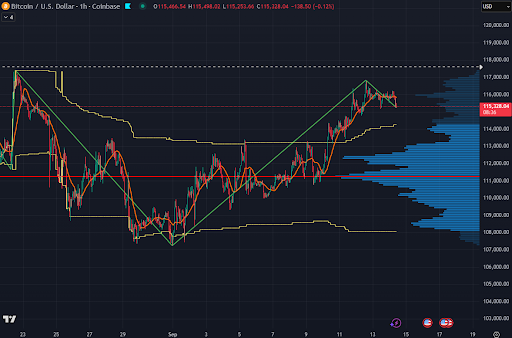
Bitcoin futures
Bitcoin’s recent rally has stalled, with the digital asset now primarily confined to a range between $110,000 and $116,000. Over the weekend, BTC traded above $116,000, but has settled back to $115,400 as of this writing.
The lack of momentum follows the cryptocurrency’s retreat from its all-time high in August, as profit-taking and a notable slowdown in institutional demand weigh on its trajectory.
With on-chain liquidity trending lower, a key shift in market dynamics is underway. The traditional finance (TradFi) demand that fueled last year’s rallies, particularly from spot exchange-traded funds (ETFs), has softened, with net flows now slowing to approximately ±500 BTC per day. As a result, derivatives markets have assumed an “outsized influence,” with futures and options activity providing the main source of price action and balance.
Analysts note that the Volume Delta Bias, a measure of cumulative volume, has recovered from the recent dip to $108,000, signaling a period of seller exhaustion. This suggests that futures traders helped absorb the selling pressure, preventing a more significant decline.
The market now sits at a critical juncture. Sustaining a rally requires a move above $114,000 to rebuild investor confidence and attract new inflows. Conversely, a definitive break below the $108,000 support band could expose the next lower cluster, with potential for a deeper decline toward $93,000.
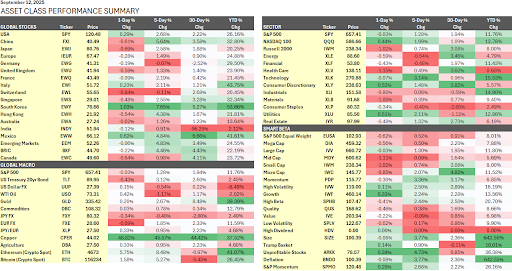
Asset class performance summary
These performance charts track the daily, weekly, monthly, and yearly changes of various asset classes, including some of the most popular and liquid markets available to traders.