

Top things to watch this week
The Economic Calendar:
MONDAY: Fed Waller Speech (6:30a CT), Fed Hammack Speech (7:00a CT), Pending Home Sales (9:00a CT), Dallas Fed Manufacturing Index (9:30a CT), Fed Musalem Speech (12:30p CT), Fed Williams Speech (12:30p CT), Fed Bostic Speech (5:00p CT)
TUESDAY: Fed Jefferson Speech (5:00a CT), Redbook (7:55a CT), House Price Index (8:00a CT), Chicago PMI (8:45a CT), Consumer Confidence (9:00a CT), JOLTs (9:00a CT), Dallas Fed Services Index (9:30a CT), Quarterly Grain Stocks (11:00a CT), Fed Goolsbee Speech (12:30p CT), API Crude Stocks (3:30p CT), Fed Logan Speech (6:00p CT)
WEDNESDAY: MBA Mortgage Applications (6:00a CT), ADP Employment Change (7:15a CT), S&P Global Manufacturing PMI (8:45a CT), Construction Spending (9:00a CT), ISM Manufacturing Index (9:00a CT), EIA Petroleum Status Report (9:30a CT)
THURSDAY: Challenger Job Cuts (6:30a CT), Jobless Claims (7:30a CT), Factory Orders (9:00a CT), Total Vehicle Sales (9:00a CT), EIA Natural Gas Report (9:30a CT), Fed Logan Speech (9:30a CT), Fed Balance Sheet (3:30p CT)
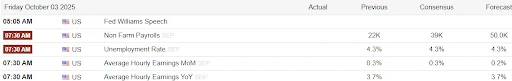
FRIDAY: Fed Williams Speech (5:00a CT), September Jobs Report (7:30a CT), S&P Composite PMI Final (8:45a CT), Baker Hughes Rig Count (12:00p CT), Fed Jefferson Speech (12:40p CT)
Key Events:
- Traders look towards the Jobs and Employment report on Friday.
- Possible Government Shutdown on Tuesday. Look for a last-minute extension.
- Quarter-end position rebalancing and window dressing on Tuesday.
- Busy FOMC speaker week – Williams, Waller, Hammack, Bostic, Musalem, Jefferson, Goolsbee, and Logan.
- Earnings are light, but we are watching the report of the consumer company Nike.
Jobs report (Friday)
Watching the jobs report closely to see if the trend of lower Non-Farm Payrolls continues. Keep an eye on Interest Rate futures after the report. The monthly report will guide the likelihood of further rate cuts this year.
Interest rate futures
We expect the Fed to cut rates further as it “looks through” near-term inflation and focuses
on a cooling jobs market.
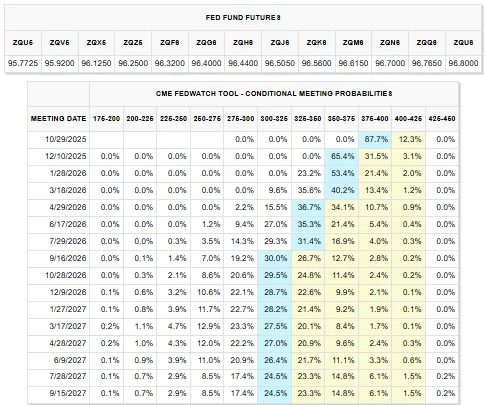
The baseline expectation is for two additional 25-basis-point interest rate cuts by year-end (October and December), totaling 50 basis points of easing from the current level, with a slight chance of a further cut.
- Implied Year-End Target: The most probable target rate range for the December 10, 2025, FOMC meeting is 375-400 bps (3.75%−4.00%) with a 65.4% probability.
- October Meeting Expectation: The market has overwhelmingly priced in a 25-basis-point cut for the October 29, 2025, meeting, with an 87.7% probability of the rate being in the 400-425 bps range (4.00%- 4.25%).
Government shutdown
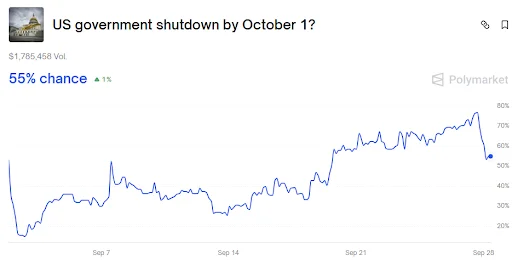
President Trump and Democratic leaders agreed to a meeting on Monday to negotiate the terms of the Government shutdown.
Polymarket trading odds were as high as 76% before the meeting was announced Saturday evening. The current odds of a shutdown are 56%.
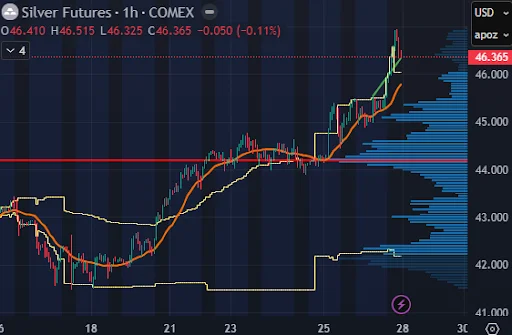
Silver futures
Silver futures explosive run isn’t just hype—structural imbalances and macro tailwinds back it:
- Supply Deficit: The Silver Institute forecasts the fifth straight annual deficit in 2025, with demand (mainly industrial) exceeding supply by over 100 million ounces. Industrial use—solar panels, EVs, electronics—hit record highs (>700 Moz expected), outpacing flat mine output. By-product silver from base metals is steady, but overall inventories are being depleted rapidly.
- Safe-Haven Flows: Geopolitical tensions (e.g., Russia-NATO airspace issues) and U.S. economic uncertainty (e.g., softer payroll revisions, potential Fed rate cuts) are funneling money into precious metals. Silver often amplifies gold’s moves, with the gold-silver ratio tightening to ~1.2% (from <1% lows), signaling silver’s catch-up potential.
- Short Squeeze Pressure: Banks and shorts are underwater, with Comex margins hiked 6.67% on Sep 26 (and more possible). This tempers retail but squeezes leveraged bears, fueling the upside. Physical premiums are rising globally (e.g., China dealers paying over the spot price), decoupling from paper markets.
- Technical Breakout: Prices smashed a multi-decade cup-and-handle pattern, with weekly closes above key resistances ($42–$45). Stochastics are overbought but momentum is strong; low volatility suggests more room before a spike.
Tariff theme is back
Trade policy updates from President Trump have unleashed significant sector rotation, particularly impacting technology and consumer goods. The core directive mandates that U.S.-based chip and semiconductor manufacturers must produce domestically an amount of chips equal to what they import on a one-to-one basis and a 50% tariff on kitchen cabinets, bathroom vanities, and associated products.
The tariffs will commence on October 1, 2025.
U.S. chipmakers, such as Intel (INTC) and GlobalFoundries (GFX), soared as it structurally favors U.S. manufacturing. The move also immediately benefited U.S. furniture and cabinet makers, with stocks such as MasterBrand (MB), American Woodmark (AMWD), and La-Z-Boy (LZB).
However, the impact was strongly negative for major retailers that rely heavily on imported goods. Shares of RH (RH), Bed Bath & Beyond (BBBY), Williams-Sonoma (WSM), and Wayfair (W) all moved lower.
Stock index futures
Watch for any quarter-end rebalance volatility early in the week.
The U.S. stock market’s relentless ascent to new records, fueled by strong corporate earnings and the prospect of more Federal Reserve rate cuts, is facing a dangerous inflection point. While bullish sentiment is stretched to a peak, a confluence of technical headwinds and crucial shifts in market liquidity suggests that the “pain trade” for investors is now decisively lower, and an interim top may be in place.
Last Monday, the Bank of America trading desk made the “kamikaze call,” suggesting that the path of least resistance for equities had shifted down. This thesis is supported by a significant, though underappreciated, negative shift in daily equity demand. This stealth headwind could remove up to $4 billion in daily buying power from the market over the coming weeks.
The most immediate and material factor is the onset of the corporate buyback blackout period, which began on September 15. Share repurchases have been a structural pillar of market support, historically representing one of the most significant continuous sources of equity demand.
The math behind this liquidity drain is significant:
- Average daily demand from buybacks executed via Volume-Weighted Average Price (VWAP) trades has been estimated at approximately $5.3 billion.
- The blackout period typically reduces this daily volume by around 35%, creating a non-trivial daily demand delta of approximately $1.5 billion that will vanish from the tape.
Compounding this shock, anecdotal evidence suggests that retail investor demand, another key driver of the recent rally, may be set to cool by as much as 50%. This combined reduction in corporate and retail buying could result in a negative delta of nearly $4 billion in daily demand, leaving the market vulnerable.
Adding to the liquidity crunch, the final days of the month and quarter are notorious for generating selling pressure from institutional players. Pension funds and other large asset managers often engage in month-end and quarter-end rebalancing, selling winners to bring their equity allocations back in line with their long-term targets. Given the massive outperformance of U.S. stocks, especially the tech-heavy names (a gap already becoming “rather wide” between Bitcoin and the tech sector, according to one market note), this rebalancing flow is expected to create an additional wave of selling.
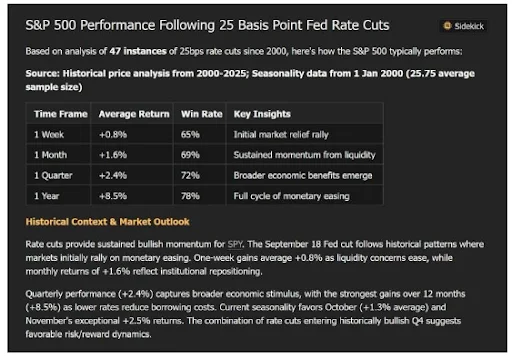
The current bullish narrative is based on the historical precedent that Federal Reserve rate cuts—such as the 25-basis-point reduction delivered at the recent September meeting—have been overwhelmingly supportive of stocks. When cuts occur outside of an economic recession, the S&P 500 has historically posted strong gains, surging an average of +8.5% after a year.
Stocks valuation
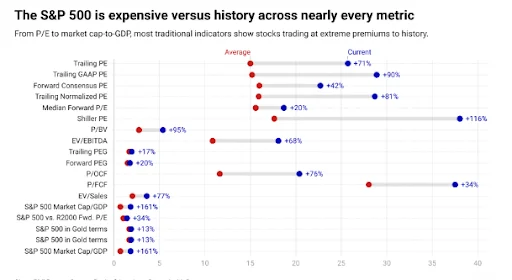
Traders are confronting a dramatic paradox as it pivots into the final and historically strongest quarter of the year: Equity markets are trading at what some analysts call the most expensive levels on record, even as powerful seasonal and structural forces point toward a continued rally.
The dichotomy presents a classic challenge as valuations are so stretched that a correction is inevitable, or will institutional tailwinds continue to defy gravity
Leading the charge on the cautionary side is Bank of America strategist Savita Subramanian, who this week delivered a stark reminder of the market’s lofty heights. In a note to clients, she highlighted that the S&P 500 index is trading at rich valuations across 19 of 20 key metrics, with four of these metrics hitting records.
“The S&P 500 trades like it’s the new risk-free rate,” Ms. Subramanian wrote, capturing the market’s seemingly immune indifference to historical pricing.
The evidence of extreme valuation is compelling:
- The Shiller P/E (Cyclically Adjusted P/E Ratio)—a widely watched measure that smooths out earnings over a decade—is currently more than double its long-term average.
- The ratio of total market value to Gross Domestic Product (GDP), often called the “Buffett Indicator,” has climbed to 1.8x of the nation’s economic output, signaling significant overvaluation relative to the underlying economy.
Despite these warning signs, Wall Street’s powerful “Q4 effect” and a host of structural tailwinds—including anticipated Federal Reserve rate cuts and persistent investor liquidity—suggest the rally may not slow down soon. The question for fund managers remains whether historical seasonality will overcome unprecedented valuation risk.
Trend following
A suggested read on the dispersion of returns of the popular futures trend following strategy. https://www.man.com/insights/deep-dive-trend-following
Bitcoin futures
Bitcoin has entered a corrective phase following the Federal Open Market Committee (FOMC) meeting, exhibiting classic “buy the rumor, sell the news” market dynamics.
Bitcoin closed Friday around $109500.
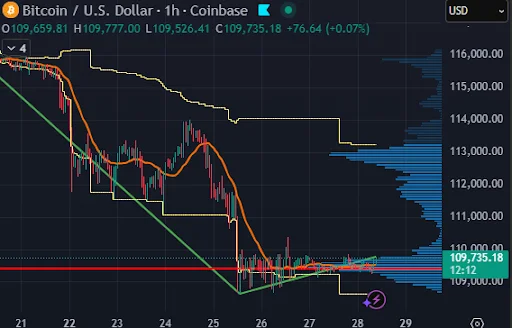
Signs of exhaustion are mounting, with a confluence of structural, technical, and on-chain indicators pointing to fading momentum and increasing downside risk.
Market structure reveals stress across both spot and derivatives markets, signaling vulnerability to further downside:
- Short-Term Holder Cost Basis (Critical Level): The $111,000 cost basis for short-term holders (STHs) is a crucial level to hold. A breach of this level would expose the market to potential cascaded selling, which we broke last week.
- Deleveraging and Liquidity Risk: The sell-off was accompanied by a spike in spot volumes and heavy deleveraging in futures markets. Liquidation clusters show the market is highly vulnerable to liquidity-driven swings on both sides.
- Options Market Shift: The options market has repriced aggressively. The skew has surged, and demand for puts is high, signaling defensive positioning. Combined with peak gamma conditions, this macro options backdrop suggests a market that is structurally exhausted.
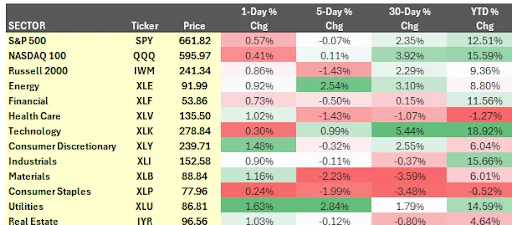
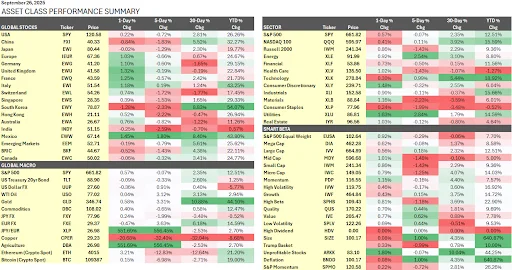
Asset class performance summary
These performance charts track the daily, weekly, monthly, and yearly changes of various asset classes, including some of the most popular and liquid markets available to traders.
All content published and distributed by Topstep LLC and its affiliates (collectively, the “Company”) should be treated as general information only. None of the information provided by the Company or contained herein is intended as (a) investment advice, (b) an offer or solicitation of an offer to buy or sell, or (c) a recommendation, endorsement, or sponsorship of any security, Company, or fund. Testimonials appearing on the Company’s websites may not be representative of other clients or customers and is not a guarantee of future performance or success. Use of the information contained on the Company’s websites is at your own risk and the Company, and its partners, representatives, agents, employees, and contractors assume no responsibility or liability for any use or misuse of such information.
Futures trading contains substantial risk and is not for every investor. An investor could potentially lose all or more than the investor’s initial investment. Only risk capital—money that can be lost without jeopardizing one’s financial security or lifestyle—should be used for trading, and only those individuals with sufficient risk capital should consider trading. Nothing contained herein is a solicitation or an offer to buy or sell futures, options, or forex. Past performance is not necessarily indicative of future results.
CFTC Rule 4.41 – Hypothetical or Simulated performance results have certain limitations. Unlike an actual performance record, simulated results do not represent actual trading. Also, because the trades have not actually been executed, the results may have under-or-over compensated for the impact, if any, of certain market factors, such as lack of liquidity. Simulated trading programs, in general, are also subject to the fact that they are designed with the benefit of hindsight. No representation is being made that any account will or is likely to achieve profit or losses similar to those shown.