

Top things to watch this week
The Economic Calendar:
MONDAY: No Economic Reports
TUESDAY: CPI (7:30a CT), Empire State Manufacturing Index (7:30a CT), Redbook (7:55a CT), Fed Bowman Speech (8:15a CT), NOPA Crush Report (11:00a CT), Fed Barr Speech (11:45a CT), Fed Collins Speech (1:45p CT), API Crude Stock Change (3:30p CT), Fed Logan Speech (6:45p CT)
WEDNESDAY: MBA Mortgage Applications (6:00a CT), PPI (7:30a CT), Industrial Production/Capacity Utilization (8:15a CT), Manufacturing Production (8:15a CT), Fed Barr Speech (9:00a CT), EIA Petroleum Status Report (9:30a CT), Fed Beige Book (1:00p CT), Fed Williams Speech (5:30p CT)
THURSDAY: Jobless Claims (7:30a CT), Import/Export Prices (7:30a CT), Philly Fed Manufacturing Index (7:30a CT), Retail Sales (7:30a CT), Business Inventories (9:00a CT), Fed Kugler Speech (9:00a CT), NAHB Housing Market Index (9:00a CT), Retail Inventories (9:00a CT), EIA Natural Gas Report (9:30a CT), Fed Cook Speech (12:30p CT), Foreign Bond Investment (3:00p CT), Fed Balance Sheet (3:30p CT), Fed Waller Speech (5:30p CT)
FRIDAY: Building Permits (7:30a CT), Housing Starts (7:30a CT), University of Michigan Consumer Sentiment (9:00a CT), Baker Hughes Rig Count (12:00p CT)
Key Events:
- Economic data: CPI, PPI, and Retail Sales.
- Q2 Bank Earnings: JPM, BAC, WFC, GS, MS
- Fed comments: Bowman, Collins, Barr, Cook, Waller, Williams.
- August 1st Tariff Deadline: U.S. tariffs are scheduled to increase.
CPI Inflationary Impact: Existing tariffs are expected to visibly drive up inflation, potentially causing markets to price out anticipated rate cuts. - Q2 Earnings Season: Corporate results will be scrutinized for real-time impacts of trade policy, inflation, and economic growth, either confirming or challenging current market valuations and future outlooks.
- Growth Concerns: The current economic resilience may falter, raising fresh speculation about a recession.
- Fiscal Worries: Fears regarding fiscal policy are expected to intensify.
- Geopolitical Shock: The risk of a geopolitical event causing a significant spike in crude oil prices remains elevated.
- VIX Seasonality: Historically, the VIX (volatility index) tends to perform strongly in Q3, suggesting an increased likelihood of market turbulence.
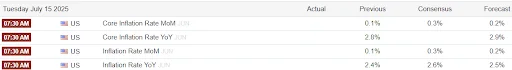
Inflation (CPI) data
Traders anticipate U.S. inflation to have accelerated in June, driven by tariff-related price increases, with both headline and core consumer prices expected to rise by 0.3% following May’s modest 0.1% gains.
This anticipated uptick in inflation, also mirrored in producer prices, will likely encourage the FOMC to delay interest rate cuts, despite broader expectations for two cuts by year-end as tariff impacts fade and the economy slows.
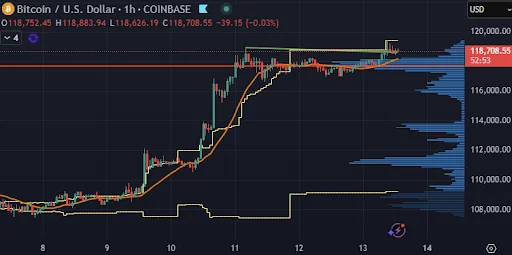
Bitcoin futures
Bitcoin continued its record-breaking rally, reaching a peak of $118,847, which led to over $1 billion in bearish crypto bets being liquidated on last Friday’s trading day.
Approximately 279,000 traders had their positions wiped out, with the largest single Bitcoin liquidation valued at $88.5 million on the HTX exchange. Total liquidations across all cryptocurrencies reached $1.29 billion, with Bitcoin futures alone accounting for $590 million, followed by Ethereum at $241 million. The majority (around 90%) of these liquidations were short positions, as traders who anticipated a market drop were caught off guard by the continued bullish momentum.
This was driven by sustained ETF inflows, with over $15 billion flowing into spot ETFs since their launch, and a supportive macro environment, including expectations of aggressive interest rate cuts. Exchanges like Bybit and HTX saw the highest liquidation volumes, with Bybit reporting $461 million, of which over 93% were short positions.
Key Drivers and Context:
- Institutional Interest: The surge in Bitcoin’s price was heavily supported by institutional buying, particularly through spot Bitcoin ETFs, which saw significant inflows. For instance, BlackRock’s IBIT ETF alone held over 700,000 BTC, contributing to price stability and upward momentum.
- Macro Environment: Announcements of potential Federal Reserve rate cuts and a supportive stance from U.S. policymakers, including Trump’s push for lower interest rates, boosted risk assets like Bitcoin. Geopolitical developments, such as tariff announcements, also played a role in market dynamics.
- Market Sentiment and Volatility: The liquidations were exacerbated by high leverage in the market, with traders using excessive leverage being wiped out during rapid price movements. Liquidation heatmaps from platforms like CoinGlass showed high concentrations of liquidations around key price levels, such as $109,963 and $110,000, indicating potential for further upward moves as liquidity was grabbed.
- Technical Factors: Bitcoin broke through key resistance levels, such as $110,000, and formed bullish patterns like an ascending triangle, signaling continued upward potential. Analysts noted targets of $115,000–$120,000 if positive macroeconomic data, such as favorable CPI data on July 11, continued to persist.
Potential Risks:
- Despite the bullish momentum, analysts cautioned about overbought signals (e.g., bearish RSI divergences) and regulatory risks. A potential market correction to $105,000 or lower was noted if macroeconomic conditions worsened.
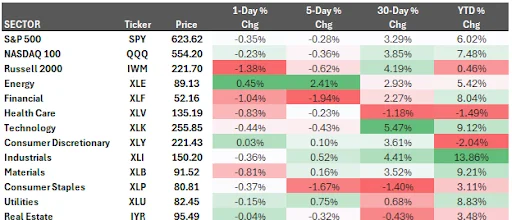
Stock index futures
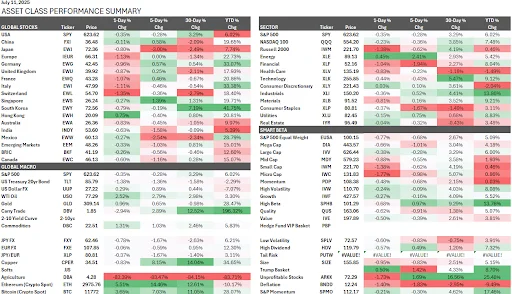
The S&P 500 index managed to post a new all-time high last week, yet the week’s trading activity has been characterized by a noticeable underlying heaviness.
Looking at the 5-Day % Change, the S&P 500 and NASDAQ 100 experienced minor declines of -0.28% and -0.36% respectively. However, several sectors, notably Energy (XLE) at +2.41% and Industrials (XLI) at +0.52%, managed to post gains over the same period, indicating some rotation or relative strength in specific parts of the market.
This nuanced market behavior is reflected in key technical indicators: the S&P 500’s distance from its 50-day moving average (50-DMA spread) has been trading sideways at an elevated level for over a month. Concurrently, the percentage of stocks within the index trading above their 50-day moving averages (DMAs) has flattened, even as the percentage above their 200-day moving averages slowly attempts to catch up. A full-throttled uptrend, typically confirmed by a higher reading in the percentage of stocks above their 200-DMAs, has yet to materialize.
Markets are currently exhaling a cautious sigh of relief as recent tariff escalations by the Trump administration have transitioned into a negotiation window. With the Federal Reserve maintaining a pause on interest rate adjustments and an increasing number of Wall Street strategists adopting a more bullish stance, the path of least resistance for equities appears to be higher. However, this optimistic outlook remains contingent on the absence of new, unforeseen shocks emanating from Washington or Beijing. Given the ongoing interplay between trade policy, political developments, and central bank actions, a swift return of market volatility could occur.
Reflecting this renewed optimism, Goldman Sachs has notably upgraded its S&P 500 return forecasts. The firm now projects the benchmark index to reach 6,400 in three months, representing a 3% upside, and to climb to 6,900 within twelve months, an 11% increase from current levels. Goldman Sachs attributes this positive outlook to anticipated Federal Reserve rate cuts later in the year and the continued robust performance of large-capitalization equities.
Trader reflection mid-year
You started January with fire in your belly and rules carved in stone. But somewhere between the first losing streak and that “can’t miss” setup, you began negotiating with yourself. Every rule you bent wasn’t just a minor adjustment—it was a declaration that your emotions know better than your strategy.
The market doesn’t care about your excuses, and neither should you. Your trading account is a direct reflection of your self-discipline, nothing more, nothing less. If you can’t trust yourself to follow a simple set of rules when money is on the line, why would you trust yourself with anything that matters?
Consistency Beats Perfection:
You don’t need to be the trader who never loses—you need to be the trader who never breaks.
The professionals you admire aren’t successful because they have some secret edge; they’re successful because they do the boring work of following their plan when it’s uncomfortable.
Every time you deviate from your rules, you’re not just risking capital—you’re training yourself to fail. Your brain is learning that discipline is optional, that rules are suggestions, and that feelings take precedence over logic.
Stop teaching yourself to lose and start proving you can win by doing what you said you’d do, trade after trade, day after day.
The Second Half Starts Now:
You have six months left to salvage this year, but only if you’re willing to get brutally honest about what needs to change. Your results aren’t a reflection of market conditions or bad luck—they’re a direct measurement of how well you’ve executed your plan.
If you want different results, you need different behavior. No more hoping, no more excuses, no more “just this once.” Either commit to your rules like your financial future depends on it, or accept that you’re just gambling with extra steps.
The choice is yours, but choose quickly—every day you delay is another day you’re teaching yourself that mediocrity is acceptable.
Interest rate futures
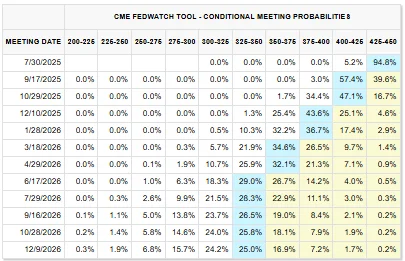
Futures markets show a 93.3% probability of no change to the federal funds rate at the upcoming July meeting, with only a 6.7% chance of a 25-basis-point reduction. This sentiment reinforces the risk of a “higher for longer” rate environment.
The Federal Reserve remains in a wait-and-see mode, prioritizing clarity on how tariffs will ultimately affect both economic growth and inflation before adjusting monetary policy.
Federal Reserve officials continue to signal a cautious approach to monetary policy, navigating persistent uncertainties surrounding trade tariffs, even as the market increasingly prices in a prolonged period of elevated interest rates.
St. Louis Fed President James Bullard noted he sees upside risks to inflation but maintains it is premature to assess the lasting impact of tariffs on the economy. Separately, San Francisco Fed President Mary Daly reiterated her expectation for two rate cuts this year, suggesting that tariff-driven inflation may prove less severe than initially feared.
Copper futures
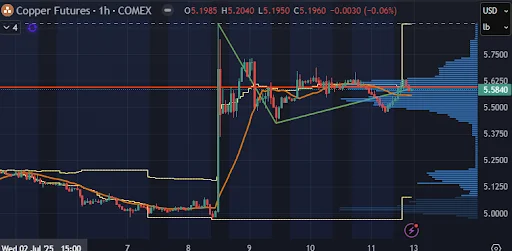
A classic economic indicator is flashing red, but not for the usual reasons.
Copper prices surged more than 10% last Tuesday, hitting an all-time high, after President Trump announced the U.S. would impose a 50% tariff on the metal. The move came a day after the administration rolled out blanket tariffs on a slate of other countries, intensifying global trade tensions. “Today, we’re doing copper,” President Trump stated during a Cabinet meeting at the White House, “I believe the tariff on copper, we’re going to make it 50%.”
While copper is often dubbed “Dr. Copper” by economists for its predictive insights into economic health, this latest rally—marking its largest one-day gain since at least 1968, according to Dow Jones data—appears to be less about booming industrial demand and more about the escalating trade war.
“This is a significant distortion,” commented Mike McGlone, senior commodity strategist at Bloomberg Intelligence. “When copper rallies, it’s usually a great sign for the economy. But this could have the opposite effect. It could curtail demand and incentivize more supply.” McGlone, a veteran of three decades in commodities, noted that this distortion is predominantly manifesting in U.S. markets, with the domestic price trading at a 25% premium above London prices on Tuesday, the widest spread on record.
The metal’s volatility has also increased significantly, with copper’s 180-day volatility hitting 28% in the first half of the year, its highest level since 2012. Copper is currently trading more than $1 above its previous year-end record close of $4.56 in 2021, a level that proved unsustainable even amidst the post-pandemic economic boom.
Tariff deadline comes and goes
The 90-day pause for the imposition of “reciprocal” tariffs expired last week, with the Trump administration now implementing another temporary reprieve until August 1. This new deadline intensifies pressure on global trading partners, as the administration has communicated threats of higher tariffs if bilateral agreements are not finalized by that date.
For months, the Trump administration has engaged in negotiations with numerous trading partners, aiming to secure new bilateral agreements. However, progress has been slow, with only tentative understandings reached so far with the United Kingdom, Vietnam, and China.
The complexity of these discussions extends beyond mere tariff levels, encompassing non-tariff barriers, commitments to purchase U.S. goods or make investments within the U.S., and intricate China-related provisions. For instance, the reported agreement with Vietnam includes a significantly higher tariff rate on exports that contain content from China.
Further complicating the negotiation landscape is the looming threat of new sectoral tariffs. President Trump has announced a 50% tariff on copper and a substantial 200% tariff on pharmaceuticals. While the latter is widely expected to be reduced, investigations are also ongoing for other products, notably semiconductors, with the possibility of additional probes being launched.
Given the significant challenges inherent in reaching comprehensive deals across dozens of countries, each with unique domestic political and economic considerations, a further delay for countries where discussions are active beyond the August 1 deadline remains possible. Conversely, the Trump administration may also opt to demonstrate its resolve by imposing higher tariffs on other nations that fail to reach agreements.
U.S. moving toward Japan 2010 policy?
The market is contemplating a bold hypothetical: could the U.S. leverage a strategy similar to Japan’s “Abenomics” from the 2010s to manage its escalating national debt?
This playbook involved aggressive Quantitative Easing (QE) by the Bank of Japan, negative interest rates, and yield curve control (YCC) to flood the market with yen and suppress borrowing costs.
The primary effect was a significant weakening of the yen, which boosted exports and eased debt management for Japan. Should the U.S. under the Trump administration adopt a similar approach—primarily through increased Fed QE and potentially YCC, though negative rates are less likely—the ramifications could be substantial. While Japan saw muted inflation from its policies, the U.S. economy’s different dynamics suggest a higher risk of inflation.
U.S. banks could face squeezed profits from ultra-low rates, mirroring Japan’s experience. Critically, a weaker dollar could aid U.S. exports but also risks undermining confidence in the greenback’s status as the world’s reserve currency. While such a strategy might buy the U.S. time on its debt, it’s not a panacea and would likely spark significant market volatility and policy debates.
Asset class performance summary
All content published and distributed by Topstep LLC and its affiliates (collectively, the “Company”) should be treated as general information only. None of the information provided by the Company or contained herein is intended as (a) investment advice, (b) an offer or solicitation of an offer to buy or sell, or (c) a recommendation, endorsement, or sponsorship of any security, Company, or fund. Testimonials appearing on the Company’s websites may not be representative of other clients or customers and is not a guarantee of future performance or success. Use of the information contained on the Company’s websites is at your own risk and the Company, and its partners, representatives, agents, employees, and contractors assume no responsibility or liability for any use or misuse of such information.
Futures trading contains substantial risk and is not for every investor. An investor could potentially lose all or more than the investor’s initial investment. Only risk capital—money that can be lost without jeopardizing one’s financial security or lifestyle—should be used for trading, and only those individuals with sufficient risk capital should consider trading. Nothing contained herein is a solicitation or an offer to buy or sell futures, options, or forex. Past performance is not necessarily indicative of future results.
CFTC Rule 4.41 – Hypothetical or Simulated performance results have certain limitations. Unlike an actual performance record, simulated results do not represent actual trading. Also, because the trades have not actually been executed, the results may have under-or-over compensated for the impact, if any, of certain market factors, such as lack of liquidity. Simulated trading programs, in general, are also subject to the fact that they are designed with the benefit of hindsight. No representation is being made that any account will or is likely to achieve profit or losses similar to those shown.