Home › Market News › Topstep Trading 101: Triangles (Part 3)
The purpose of this series is to educate you on the basic techniques and principles of technical analysis. To a lot of you, this is old news, but for the rest of you, we are here to help you build a solid foundation for reading chart patterns.
In part 1 of this series we touched on symmetrical triangles, then in part 2 we focused on ascending and descending triangles, so today we will be taking a look at expanding, or broadening, triangles.
Expanding Triangle
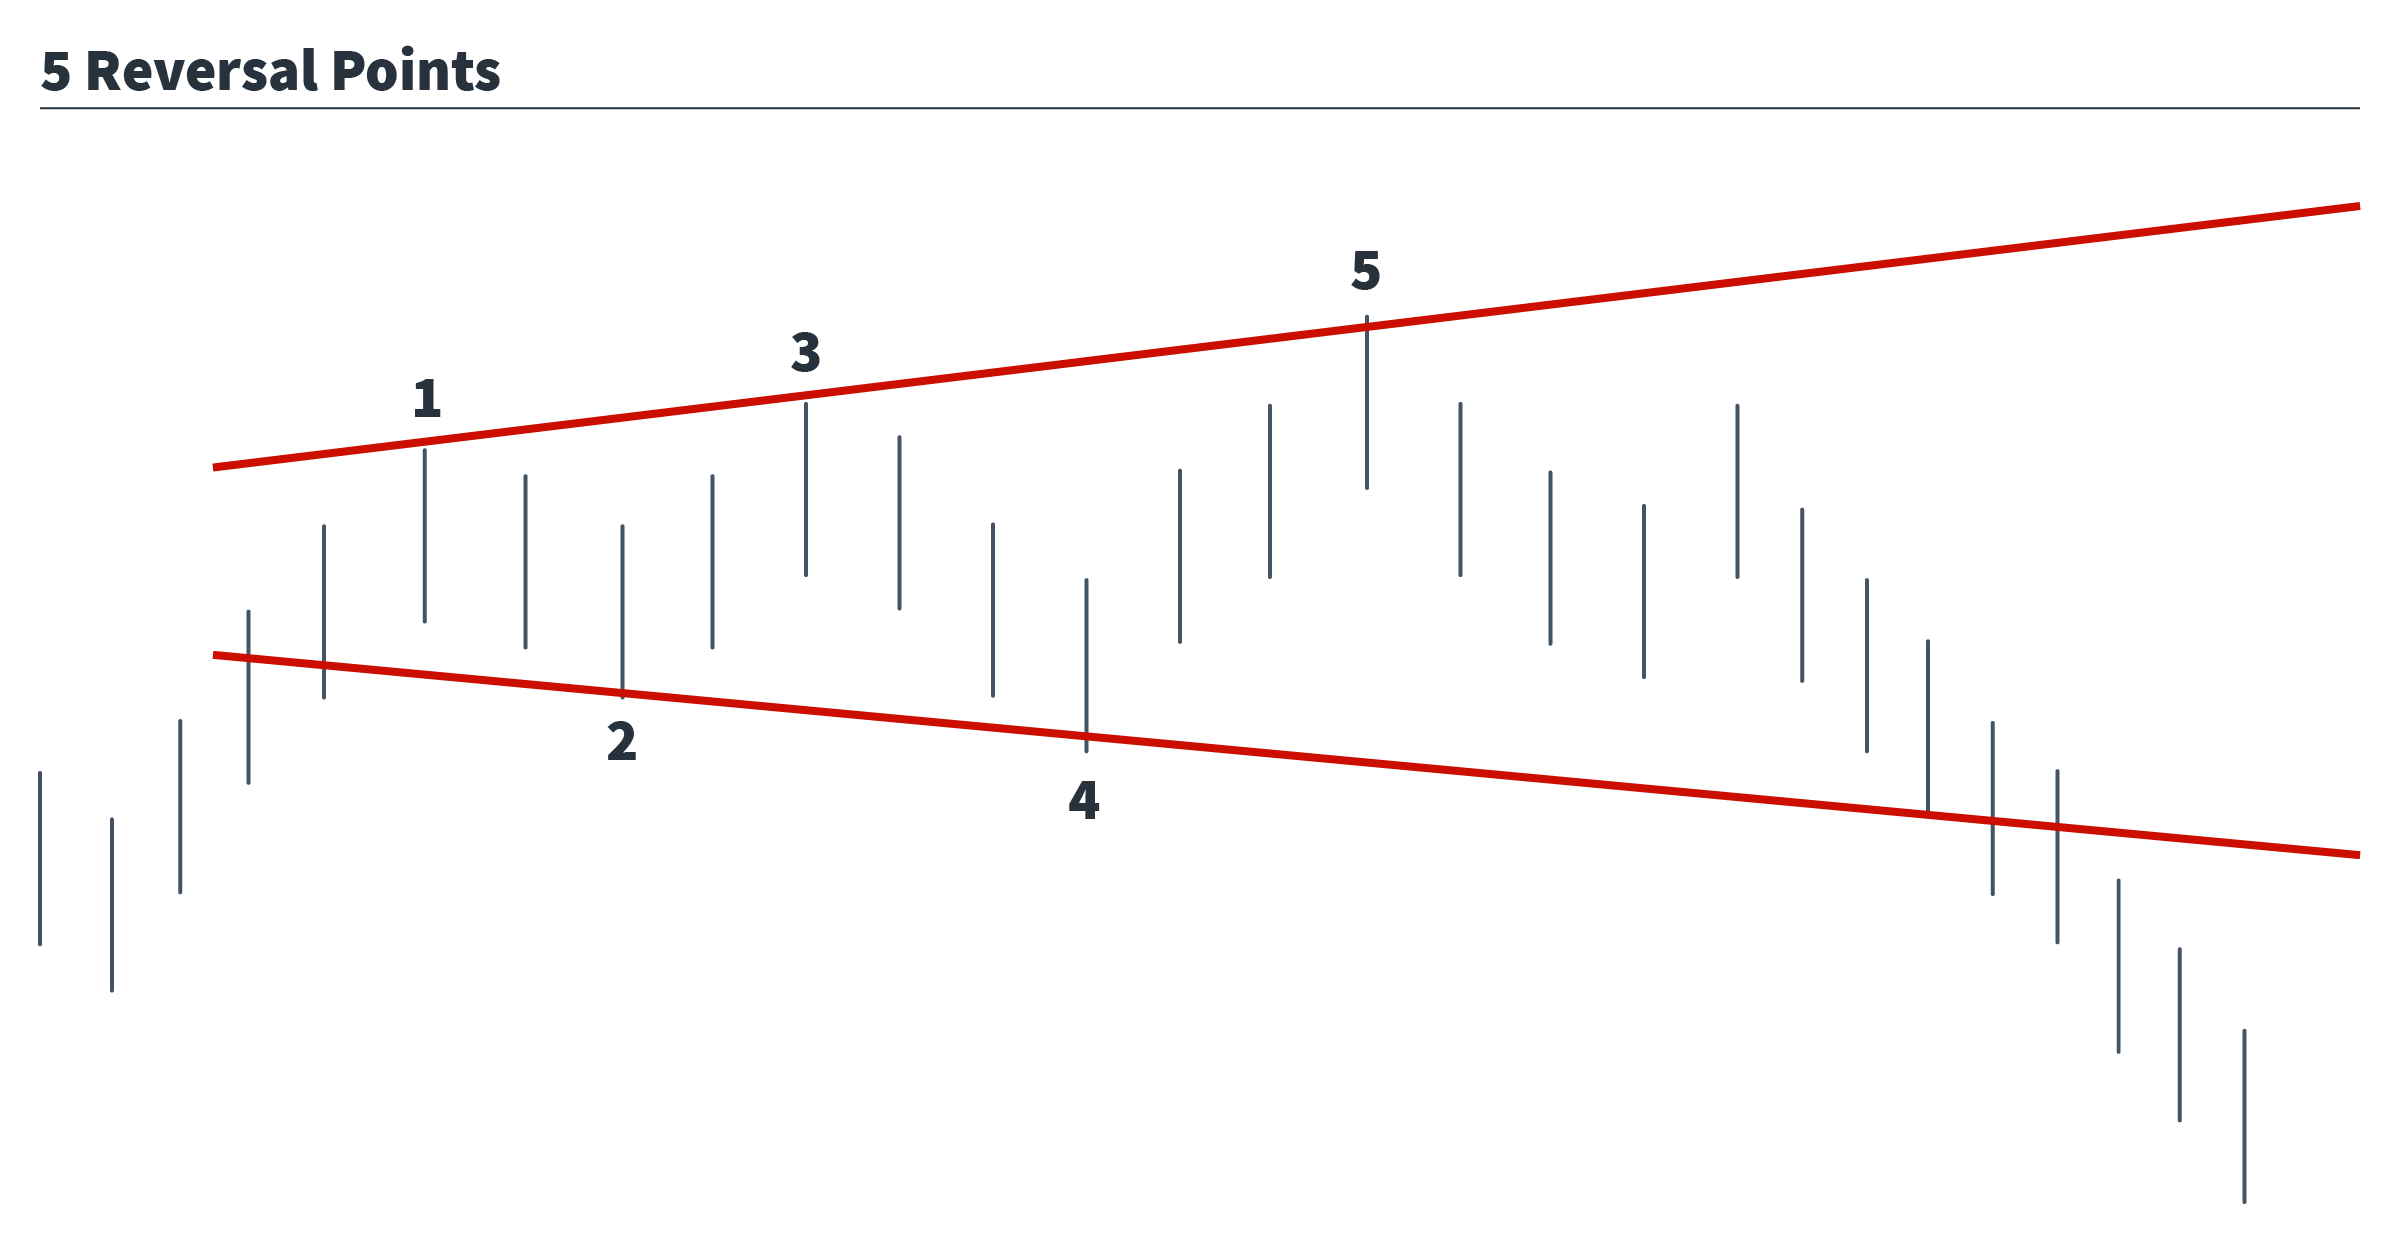
The expanding triangle is typically the most rare of the 4 triangle patterns, and is usually considered to be a bearish setup found at major market tops. Unlike the other patterns, which center around 2 trendlines converging towards each other to form an apex, the expanding triangle is just the opposite, and consists of 2 trendlines starting at an apex and diverging away from each other.
So, instead of seeing a series of lower highs and higher lows, you will see a series of higher highs and lower lows.
The volume pattern is also different. When a symmetrical or A&D setup begins to form, you would expect to see volume dropping as price moves towards the apex. It’s the opposite for the expanding pattern, where you should see volume start to grow as price continues to expand.
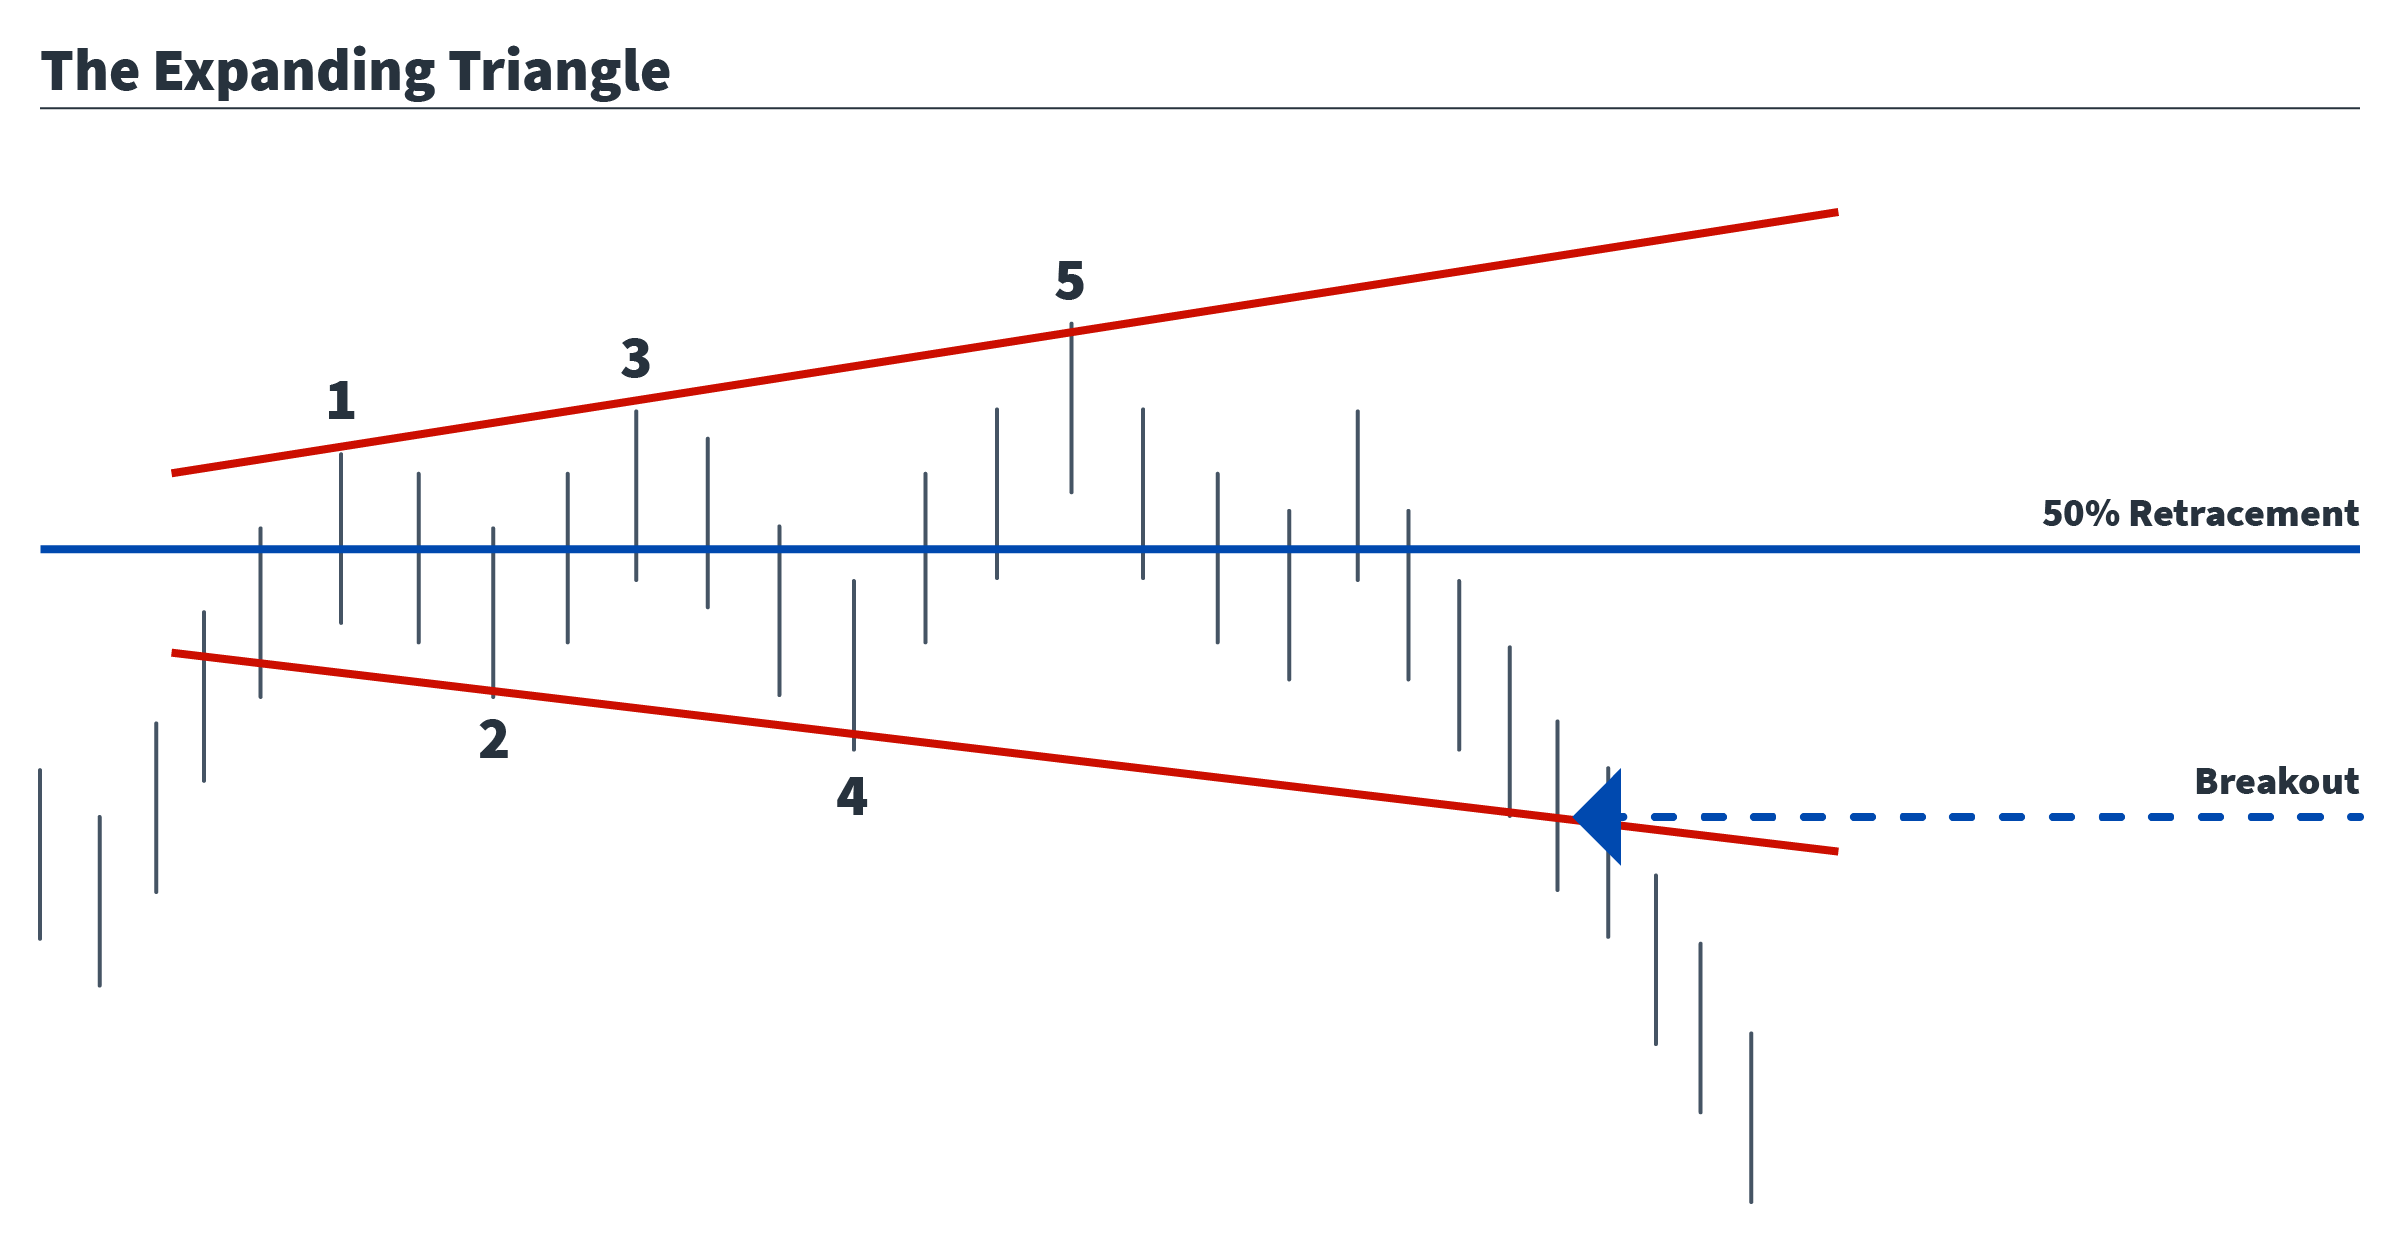
The last major difference that makes the expanding pattern unique is that it requires a minimum of 5 reversal points to be confirmed, as opposed to the other 3 triangle setups which require a minimum of 4 reversal points, with a breakout typically occurring after the 5th reversal.
This is definitely the most confusing of the triangle patterns, and breakout traders tend not to use it as a trade setup unless it falls in line with a number of other indicators. The high probability of false signals and wide retracement ranges make it a nightmare for managing risk, so it is most often used as a signal that a change in trend is occurring.
Short terms traders have been known to use the diverging trendlines for scalping, or day trading purposes. If the pattern is correctly identified in its early stages, the upper and lower trendlines can be considered support and resistance areas, with stops outside the breakout areas and profit targets in the area of a 50% retracement.
More aggressive traders will assume that a change in trend is developing as soon as they see the pattern begin to form and use the upper trendline as a resistance area to sell against. This is the least risky approach, but there is always the possibility of another higher high.
As with any other trade setup, you should know where you’re getting out before you get in. Proper risk management is the key to keeping yourself in the game for another day.
Trade Well!