Home › Market News › 3 Indicators ES Traders Need to Watch
The SierraChart platform alone has about 400 technical indicators, with hundreds more available to purchase from third-party vendors. Beyond the realm of technical indicators, you can use other securities or indexes as an indicator for the security you’re trading.
The point I’m trying to get across here is that the signal-to-noise ratio in the trading world is abysmal. At each corner you turn, someone is trying to sell you an indicator, a system, alerts, chat rooms, and so on. Just a handful of these tools of the thousands of options you have are valuable.
In this article, we look at three indicators that /ES traders can use to reduce the noise they experience from indicator overload: VWAP with standard deviation bands, the TICK index, and market profile.
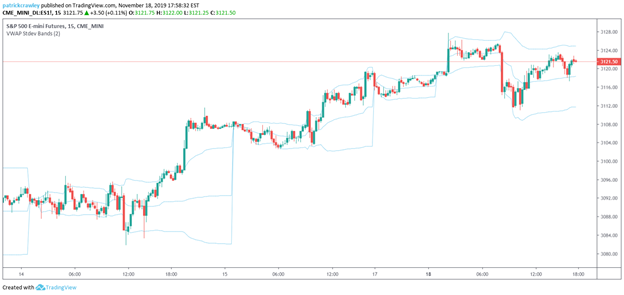
VWAP with 2 standard deviation bands applied to the 15-minute chart of /ES
The volume-weighted average price (VWAP) is an indicator used by virtually every trader, retail or institutional. The VWAP’s calculation is in its name: you establish an average price based on how much volume is executed at each price. Below is the calculation used by most charting platforms:
Cumulative(Typical Price x Volume) / Cumulative(Volume)
VWAP is a bit different from most technical indicators in that it’s not calculated using an arbitrary lookback period. Most technical indicators require traders to use some discretion when choosing a lookback period, leading to questions like “what makes an RSI lookback period of 14 bars any better than one of 15 bars?” The VWAP’s lookback period is based on regular trading hours (RTH) between 8:30 am and 3:15 pm EST for contracts listed on the CME. VWAP is calculated within these hours and reset every trading session.
In the same way that hedge funds’ performance is compared to the S&P 500 as a benchmark, an asset’s VWAP is treated as a benchmark for an institutional trader’s execution abilities. Traders are judged by their skills to consistently sell their clients’ assets above VWAP and buy them below the VWAP.
Perhaps an institutional trader is given an order to sell a million shares of a stock for a client within a day. The trader’s primary goal is to sell those shares above the VWAP. Given that those million shares will have a significant downside market impact, selling above VWAP becomes a challenge.
There are several reasons that institutions heavily favor VWAP as an execution benchmark. Still, the primary motive is that VWAP-based benchmarks tend to underestimate transaction costs, making traders look more skilled than they might be.
If you’re coming from the stock trading world, you’re probably familiar with Bollinger Bands, which plot a standard deviation around a moving average. VWAP bands work in the same way, except the standard deviation bands are plotted around the VWAP.
Like most technical indicators, traders utilize them differently based on their style and the current market environment. VWAP bands are versatile because they have utility in both range-bound markets and trending markets.
Typically in ranging markets, you want to fade any overextensions from the dominant trading area, often referred to as the value area by market profile traders. In trending markets, you want to find a spot to enter a trend on a retracement.
In range-bound markets, VWAP is useful for fading overextensions from the dominant area of trading, often referred to as the value area or point of control among market profile traders. VWAP with standard deviation bands work in the same way that many momentum oscillators like RSI do: they function as overbought/oversold indicators in ranging markets and as momentum indicators in trending markets.
Below is a chart of /ES with 2 standard deviation bands plotted around the VWAP. As identified by the ranging price action, low relative volume, and low ADX, the market is trading is bouncing around in a range.

Situations like these make fading large deviations from VWAP attractive; there’s limited momentum in the market, making it likely that the market will retrace back to the VWAP. We owe this to the fact that the VWAP is where the majority of trades have taken place.
Because there is no momentum, catalyst, or large order that will move the market, the deviation from the VWAP was likely random price action attributable to the diverse participants trading for varying reasons (hedging, exposure, different time frames).
In trending markets, the VWAP itself becomes an excellent point to enter on trend pullbacks. You’ll usually be stopped out quickly if you’re trying to fade what looks like an overextension with significant momentum present.
When significant momentum is present, we want to shift our use of the VWAP indicator from an overbought/oversold indicator to a trending indicator. During range-bound markets, VWAP bands work similarly to an RSI, and during trending periods, the VWAP acts more like an ADX (Average Directional Index).
Unless considerable momentum is present, the VWAP is usually established in the first 30 minutes of trading, hardly moving for the rest of the session. You know the trend is strong when the VWAP is moving directionally intraday. These are periods when we want to trade trend continuation setups.
To trade pullbacks of trends, you first have to determine if the market is trending. This is the trend “green light,” you stop fading moves in these conditions and look to ride trends. Then you have to quantify the strength of the trend: how many consecutive higher highs/higher lows (and vice versa) has it made in a row? This gives you conviction. Strong trends are more likely to continue. From there, you have to quantify momentum, or how much velocity is behind the trend’s price changes.
Determining these three trend factors will allow you to further categorize market behavior within the “trending” label.
The NYSE $TICK index is a market breadth indicator that weighs the difference between up ticking issues and down ticking issues on the New York Stock Exchange. For example, the NYSE has roughly 2,800 stocks listed on its exchange—if 1500 are on an uptick, and 800 are on a downtick, the index’s value would be the difference between those values (1500 – 800 = 700). In this case, the value would be +700, which tells that 700 more stocks are up ticking than down ticking at the moment.
Most traders who make use of the TICK apply it as an overbought/oversold indicator, similar to the way the RSI (Relative Strength Index) is used: an oversold reading indicates that the market is poised to rally soon, and vice versa for overbought. With that said, the index does have utility as a correlation or convergence/divergence indicator during trending markets.
This view, of course, has some problems. We all know traders who have insisted that symbols are “overbought,” trying to short into enormous momentum, only to get a margin call. We can’t view these indicators in a vacuum; they have to become part of a larger picture. In particular: we have to identify current market conditions. As we’ve discussed earlier concerning VWAP, overbought/oversold readings only work in quiet, sideways ranging markets.
Once we’ve classified the current market environment as range-bound, then we can shift our focus to fading overextensions.
Below is a chart of the TICK with four levels marked. Those are +1000, -1000, +800, and -800. These are the “extreme” levels, which indicate that many more stocks are ticking in one direction than the other. The thinking that usually follows is that this will turn around, making an extreme TICK reading a good point to enter an /ES trade in the opposite direction.
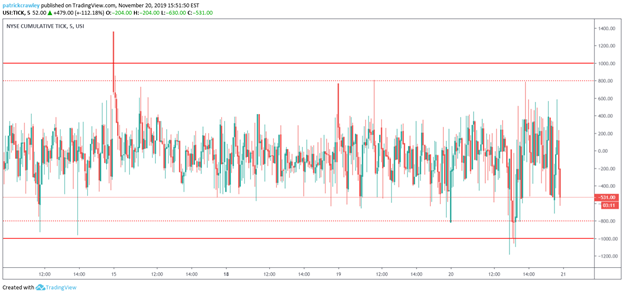
Readings of 1000 on either side seldom occur during range-bound conditions, making fading these unfavorable. However, we want to be aware when the TICK reaches these levels as it can be a sign of a trend reversal, trend climax, or the start of a trend. It’s a good idea to set alerts for the TICK reaching +/- 1000; it indicates severe aggression on the side of the supply/demand relationship.
We do see readings of +/- 800 during range-bound markets on a semi-regular basis, however. These become excellent mean reversion opportunities that don’t necessarily indicate the start of a trend.
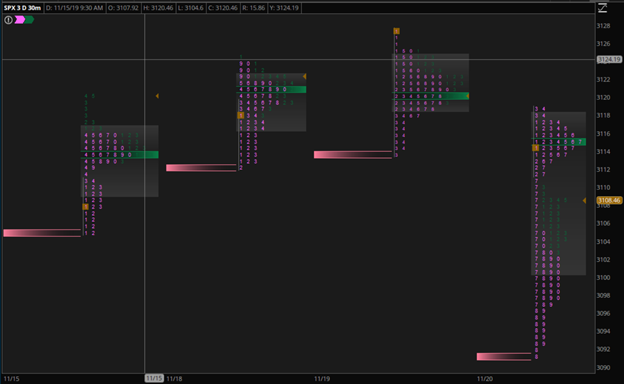
A market profile is a way of displaying market data concerned with the amount of volume or time spent at a specific price. Practitioners of market profile attach significance to prices where a considerable quantity of volume has been executed. Similar to VWAP, the idea is that when price frequently trades around one level, that level is significant, and that significance can be used to create profitable trading opportunities.
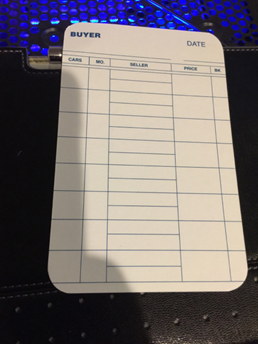
Market profile came about from pit trading. Traders in the pits would create their market profiles based on how long the price stayed at levels. Because of that era’s limited computing power, intraday volume data was pretty scarce, so they had to work with a time-based market profile, which is only one part of the modern market profile.
Pit traders created these makeshift market profiles based on the order cards they were required to fill out and submit every 30 minutes. Below is a picture of one of those cards, sourced from futures.io member Blash:
The concept of market profile was founded on the principles of auction market theory, which holds that markets’ function is to balance the auction between buyers and sellers. In this balance, the concept that market profilers call value is found. In contrast to classical technical analysts who view the current market price as the current value, profilers see price as a potential opportunity to be seen relative to the area of value established through their volume analysis.
There’s a negotiation between buyers and sellers in any market, where buyers aim to pay the lowest price, and sellers aim to sell for the highest price. Throughout this negotiation, the market establishes a value area, which ranges from where most transactions occur. For example, the price of a used iPhone X on eBay is usually around $450. Some sell for $400 and some for $500, but most of the transactions are taking place around the $450 area, making the iPhone’s value area $450. On a conceptual level, it’s as simple as that for futures as well.
If market participants are roughly aware that the iPhone’s value is $450, they will aggressively buy at $400 and aggressively sell at $500.
Once you’ve understood the simple philosophy behind auction market theory, it’s a matter of understanding how to read a market profile chart and watching how price behaves when it’s within its value area and when it deviates from it.
Even with thousands of indicators to choose from, we find that most of them achieve the same primary goals: to identify overbought or oversold conditions and quantify a trend’s direction or strength.
Even market profile, which strikes most as a radically different way to view the market, still operates on the philosophy of mean reversion. When price deviates too far from its value area, then it’s likely to revert.
If you’re interested in learning more about trading futures, be sure to check out our beginner’s resources, including the 5 Ways to Stop Gifting Money to the Markets, our Futures Primer for Retail Stock Traders, and our Beginner’s Guide to Trading Crude Oil Futures.